
Combining Office for National Statistics data with first-party data requires aligning external macroeconomic indicators with internal transactional records through shared geographic, demographic, and temporal variables to build a unified analytical dataset.
Generating credible industry research demands rigorous methodology. Brand researchers bridge public datasets and private metrics by matching standard industrial classifications and geographic boundaries.
Harmonizing External and Internal Variables
Official datasets provide macroeconomic context. First-party metrics supply transactional reality. Researchers align these sources by converting raw databases into compatible formats. Standardizing date ranges and geographic codes ensures data integrity before statistical modeling begins.
Which Office for National Statistics datasets support UK market research?
The Office for National Statistics publishes essential datasets including the Annual Survey of Hours and Earnings, Retail Sales Index, Gross Domestic Product estimates, and Labour Force Survey to establish baseline economic indicators.
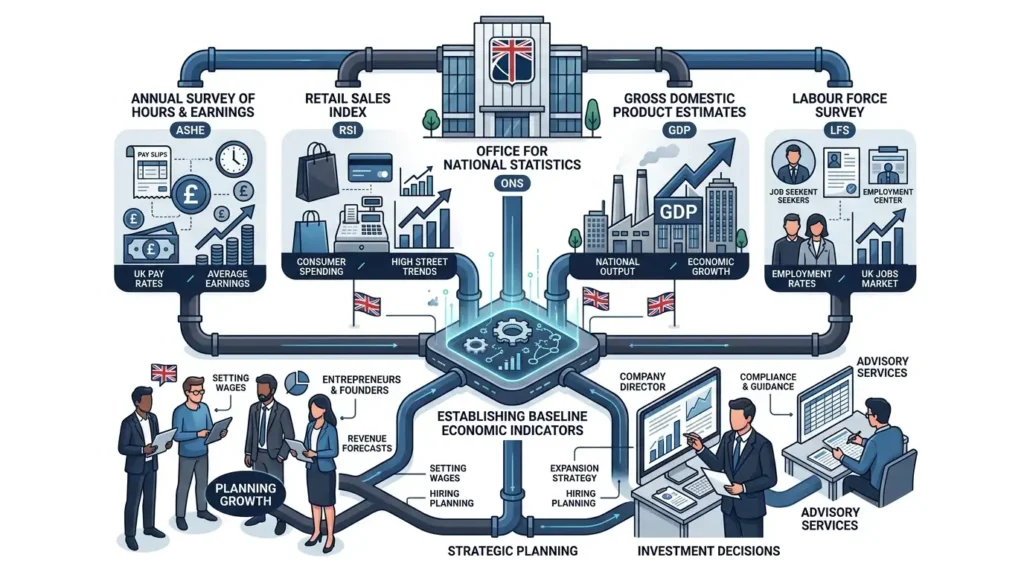
Selecting appropriate public databases determines study validity. Analysts choose datasets matching their specific sector requirements.
Key Public Data Sources
- Annual Survey of Hours and Earnings (ASHE): Provides precise figures on employee earnings, distribution, and hours worked across regions.
- Retail Sales Index (RSI): Measures sales values and volumes in the retail sector, indicating consumer spending habits.
- Labour Force Survey (LFS): Tracks employment status, economic activity, and demographic shifts across the United Kingdom.
- Business Register and Employment Survey (BRES): Details employment counts by industry and geography down to local authority levels.
How do brands clean and structure first-party data for integration?
Cleaning and structuring first-party data involves removing duplicate entries, resolving missing values, standardizing categorical variables, and aggregating customer metrics into standardized time periods.
Raw internal records contain errors that distort analysis. Data engineers apply strict protocols to sanitize enterprise databases.
Data Sanitization Steps
- Deduplication: Removing redundant customer entries prevents skewed frequency distributions.
- Missing Value Imputation: Addressing gaps in transaction records maintains dataset continuity without introducing bias.
- Variable Normalization: Converting currency values to constant prices accounts for inflation over multi-year analyses.
What methodologies validate the merged dataset?
Methodologies for validating merged datasets include cross-sectional regression analysis, normalization techniques, variance inflation factor testing for multicollinearity, and confidence interval estimation.
Integrating external statistics with internal metrics introduces statistical risks. Analysts apply quantitative tests to verify model reliability.
Testing for Statistical Robustness
Researchers utilize regression models to test correlations between macroeconomic indicators and internal sales volumes. Testing for multicollinearity prevents redundant variables from inflating statistical significance. Normalization ensures that large public figures do not overshadow granular internal metrics during computation.
Explore More Expert Insights:
How to Brief a UK Publisher for Sponsored Content That Feels Like Real Journalism
Sponsored Content Across 10 Verticals: UK Engagement Benchmarks 2026
How do organizations present blended data in a credible industry report?
Organizations present blended data through transparent methodological disclosures, standardized charts, clear comparative baselines, and explicit definitions of all combined metrics.
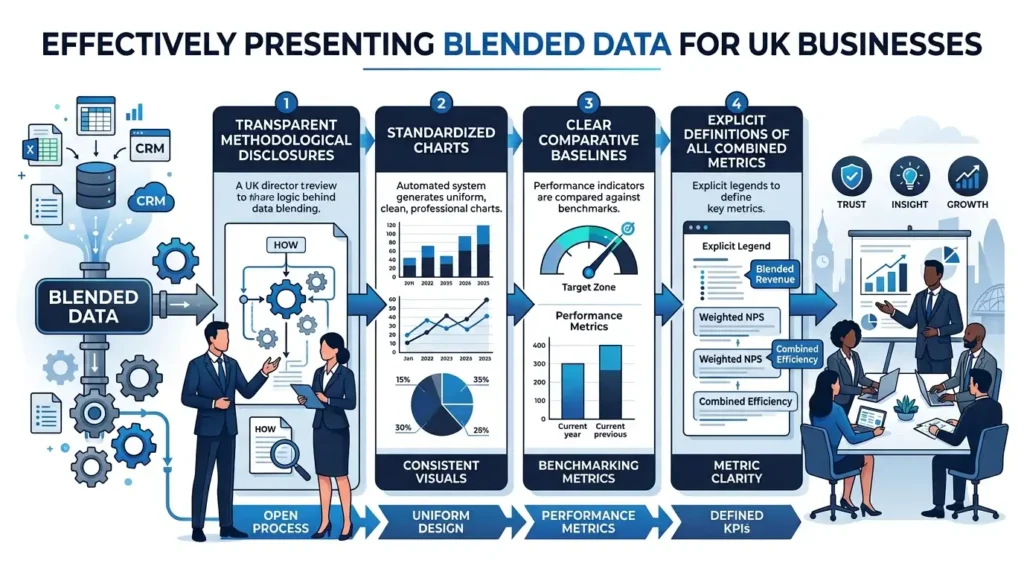
Credibility relies on absolute clarity regarding data origin and transformation steps. Industry reports must document every phase of the research process.
Structuring the Research Output
Reports incorporate detailed methodology sections that cite specific Office for National Statistics publication codes. Visualizations display both macroeconomic trends and internal growth metrics on dual-axis charts to illustrate market alignment clearly.
Readers interested in the foundational research phase can explore Which Official UK Statistics Can Brands Use as the Foundation for a Research Report?.
What are the commercial benefits of publishing data-backed industry reports?
Publishing data-backed industry reports enhances brand authority, generates high-intent inbound leads, secures earned media coverage, and establishes proprietary market benchmarks.
Industry reports serve as powerful content assets for mid-funnel marketing strategies. Organizations utilize published insights to demonstrate deep market expertise.
Driving Business Growth Through Research
Combining public statistics with proprietary data creates unique content that competitors cannot replicate. Media outlets cite these reports, increasing brand visibility across target sectors.
Organizations seeking professional execution for these projects can utilize Time Intelligence Media Group Research and Reports Services Using Official UK Statistics to streamline data integration and publication.
Producing a credible UK industry report requires precise integration of macroeconomic data from the Office for National Statistics with internal first-party metrics. Harmonizing these disparate sources through rigorous data cleaning, statistical validation, and transparent reporting establishes authoritative market insights. Brands leverage these blended studies to build industry leadership, secure media citations, and guide strategic decision-making across the United Kingdom.