
Translating technical findings into plain English means explaining statistical results using precise, accessible language without changing their measured meaning. It preserves sample sizes, percentages, relationships, uncertainty, significance levels, and methodological context while removing unnecessary technical complexity from report sections.
Technical findings often contain statistical terminology, research methods, numerical relationships, and methodological qualifications. Business reports need to communicate these findings to people who do not work with statistics every day.
Plain-English reporting does not mean simplifying the evidence until important information disappears. It means changing the presentation while preserving the underlying result.
For example, a technical statement can report that a survey identified a statistically significant relationship between employee training participation and reported productivity. A plain-English version explains what that relationship means in practical terms while retaining the relevant statistical qualification.
The central principle is accuracy before simplicity. Every rewritten statement needs to communicate the same evidence as the original finding.
This approach connects with the broader principles discussed in plain English research, where clear language helps business audiences understand complex research without removing important evidence.
How can you identify the statistical information that must remain?
The statistical information that must remain includes the population or sample, measurement, result, comparison, statistical significance, uncertainty, and relevant limitations. Removing any information that changes interpretation reduces the accuracy of the report section.
Start by separating essential statistical information from technical wording.
A technical finding can contain several components:
- Sample size
- Population or study group
- Measurement method
- Percentage or numerical result
- Difference between groups
- Correlation or association
- Statistical significance
- Confidence interval
- Margin of error
- Study period
- Relevant limitation
Not every report requires every component. The reporting requirement depends on the research design and the decision context.
For example, a survey of 2,000 UK employees reporting that 64% supported flexible working provides a different level of information from a statement saying most employees supported flexible working.
The percentage provides measurable evidence. The sample size establishes the scale of the survey. The population identifies who participated. Removing these details can make the statement less precise.
Which numbers need to stay visible?
Numbers that directly support the finding need to remain visible when they materially affect interpretation.
If research reports that customer satisfaction increased from 71% to 79%, reporting only that satisfaction increased hides the 8-percentage-point change.
If a report states that a campaign generated a 25% increase in engagement, the underlying measurement also matters. Engagement can represent clicks, comments, shares, views, or another defined metric.
Plain-English writing therefore requires numerical precision and measurement clarity.
How do you convert statistical terminology into plain English?
Convert statistical terminology by explaining what the statistical result demonstrates, retaining the numerical evidence, and removing specialist wording that does not add meaning. The rewritten sentence must describe the same measured relationship, difference, probability, or uncertainty as the technical source.
Statistical terminology often creates unnecessary barriers when the audience does not need the technical label.
For example:
Technical wording: The intervention produced a statistically significant increase in response rates with p < 0.05.
Plain-English wording: Response rates increased after the intervention, and the statistical analysis found that the increase was unlikely to be explained by random variation alone.
The second version explains the significance rather than simply removing it.
The term statistically significant has a specific meaning. It does not mean important, valuable, successful, or large. A statistically significant result can have a very small practical effect.
This distinction needs to remain clear throughout the report.
How should correlation be explained?
Correlation describes an association between two measured variables. It does not establish that one variable caused the other.
For example, research can identify a positive relationship between training hours and employee productivity. The report needs to distinguish this association from a causal claim that additional training directly produced the productivity increase.
A precise plain-English sentence states what the research measured rather than adding a causal explanation that the evidence does not establish.
How can you simplify a complex research finding without changing its meaning?
Simplify complex findings by separating the result from its technical explanation, retaining the evidence that affects interpretation, and replacing specialist terminology with direct descriptions. The simplified statement must remain equivalent to the original statistical finding in meaning and scope.
A useful process begins with the original technical statement.
Consider a research finding reporting a 12% increase in average customer retention, with a 95% confidence interval ranging from 7% to 17%.
A simplified version can state:
Customer retention increased by an average of 12%, with the analysis placing the estimated increase between 7% and 17%.
This version removes unnecessary statistical construction while retaining the estimate and confidence interval.
The confidence interval is important because it communicates uncertainty around the estimated result. It does not mean that 95% of individual observations fall between 7% and 17%.
How should confidence intervals be presented?
Confidence intervals need careful wording because they describe uncertainty around an estimated population parameter.
A report can state that the analysis estimated a 12% increase, with a 95% confidence interval from 7% to 17%.
For a general business audience, this formulation provides the key information without requiring a detailed explanation of statistical theory.
The report can explain the relevance of the interval when the range affects interpretation. A narrow interval indicates greater statistical precision than a wide interval under the same methodological conditions.
What report sections require the most statistical care?
Results, executive summaries, findings, methodology summaries, recommendations, and data interpretation sections require different levels of statistical detail. Each section needs consistent numbers and terminology while presenting evidence at the level appropriate to its reporting purpose.
Different report sections perform different communication functions.
The executive summary presents the most important findings in concise language. The findings section provides supporting evidence. The methodology section explains how the evidence was produced. Recommendations connect documented findings with defined business actions.
The same result can therefore appear in several sections without using identical wording.
For example, an executive summary can state that customer retention increased by 12%. The findings section can provide the sample size, measurement period, confidence interval, and comparison group.
Consistency matters. A report must not state a 12% increase in one section and an 11% increase elsewhere unless the two figures represent different calculations.
How should executive summaries handle technical findings?
Executive summaries need direct statements that preserve decision-relevant evidence.
A strong summary identifies the finding, measurement, scale, and relevant qualification.
Instead of writing that regression analysis demonstrated a significant positive coefficient, the report can explain that higher training participation was associated with higher productivity scores, followed by the relevant statistical measurement where required.
This structure gives business readers the result first and the technical detail second.
How can writers preserve statistical accuracy during editing?
Preserve statistical accuracy by comparing every edited sentence with the source analysis, checking every number, retaining necessary qualifications, and confirming that terminology still describes the original statistical method and result. Editing changes language, not evidence.
A statistical accuracy check needs to happen after plain-English editing.
Check every percentage, decimal, date, sample size, unit, comparison, and direction of change.
Then check terminology.
A report that originally describes an association must not become a report claiming causation. A confidence interval must not become a prediction range. Statistical significance must not become business significance.
The reporting team also needs to check rounding.
For example, an original result of 64.7% can be reported as 65% when the reporting convention allows rounding. However, the same rounding rule needs to apply consistently across comparable findings.
What is the role of source tables?
Source tables provide an important accuracy reference during rewriting.
Writers can use them to verify:
- Original values
- Denominators
- Sample sizes
- Group definitions
- Measurement periods
- Units
- Statistical tests
- Confidence intervals
- Significant differences
A final report needs a traceable relationship between the published statement and the underlying analysis.
Explore More Expert Insights:
How to Turn Fresh Data Into a Rapid-Response UK Media Story Within the News Cycle Without Sacrificing Accuracy in 2026
How to Refresh a Published Research Report and Preserve the Rankings, Backlinks and Citations It Has Already Earned in 2026
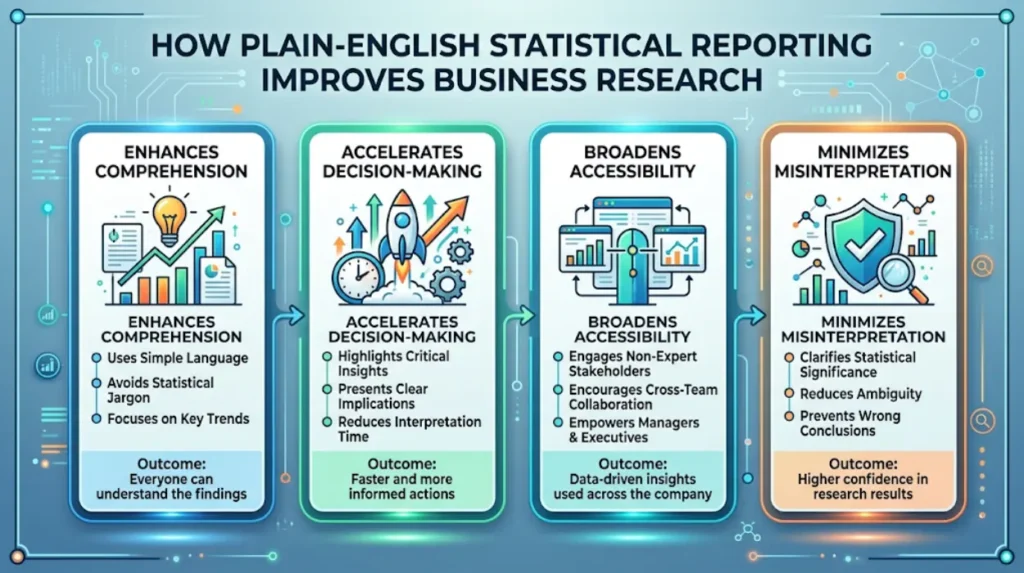
How does plain-English statistical reporting improve business research?
Plain-English statistical reporting improves business research communication by making measured findings easier to understand while retaining evidence needed for interpretation. It reduces unnecessary technical language and helps business audiences identify relevant results, comparisons, limitations, and measurable changes.
Business research often serves multiple audiences.
A research report can be reviewed by analysts, senior managers, operational teams, communications professionals, investors, policymakers, and external stakeholders. These groups do not require identical levels of statistical detail.
Plain-English reporting creates a common information layer.
For example, a workforce report can state that employee turnover decreased from 14% to 10% over a defined 12-month period. A methodology section can then explain the calculation and dataset.
This structure allows readers to understand the finding without removing the evidence required to verify it.
Clear statistical writing also supports search visibility because well-defined findings provide explicit entities, measurements, relationships, and context that search engines and AI systems can interpret more consistently.
When should businesses use plain-English editing for research reports?
Businesses use plain-English editing when technical research needs to reach non-specialist audiences without removing statistical evidence. Common applications include market research, employee surveys, customer studies, financial analysis, policy research, performance reports, and commissioned business research.
The approach is relevant whenever research findings need to move between technical analysis and business communication.
Market research reports can translate survey results into clear customer insights.
Employee research can explain workforce statistics without unnecessary methodological terminology.
Customer experience reports can describe satisfaction scores, response rates, and changes between reporting periods.
Financial research can present measured changes while retaining the definitions and periods behind the figures.
Policy research can explain survey evidence, population characteristics, and statistical findings for professional audiences.
In each case, the objective remains consistent: improve readability without changing the evidence.
What does a plain-English research workflow look like?
A practical workflow contains several stages:
- Review the original analysis to understand the evidence.
- Identify the core finding and its supporting measurements.
- Separate essential statistics from technical wording.
- Rewrite the finding in direct language.
- Retain relevant qualifications and limitations.
- Check numbers against the source dataset or table.
- Review terminology for statistical accuracy.
- Check consistency across all report sections.
- Complete a final readability review.
This workflow separates interpretation from editing. The writer first establishes what the evidence says and then determines how to communicate it clearly.
How can research teams connect plain-English reporting with professional report production?
Research teams can connect plain-English reporting with professional production by combining statistical review, structured editing, consistent terminology, source verification, and audience-focused presentation. This creates report sections that remain technically accurate while communicating findings clearly to defined business audiences.
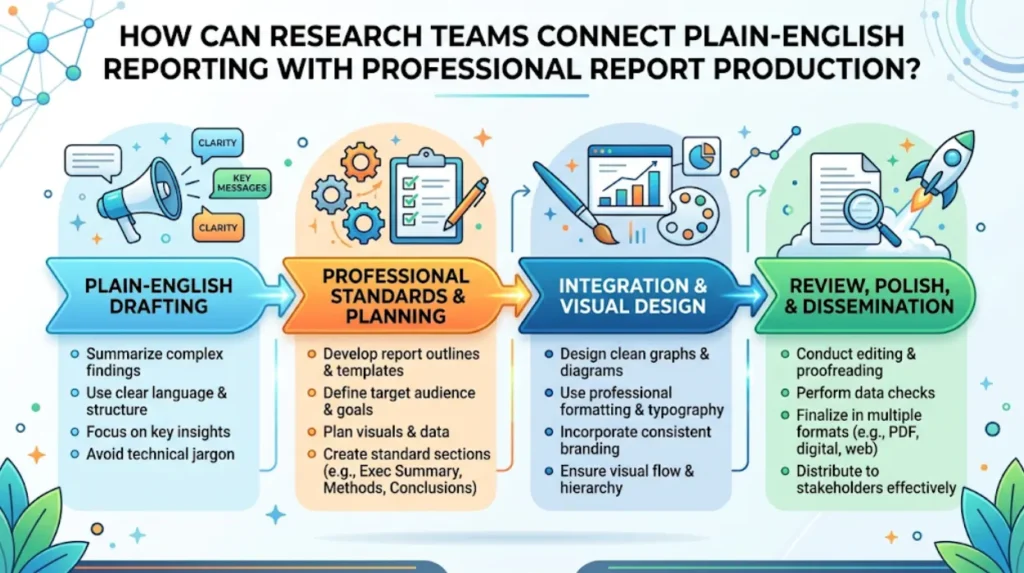
Plain-English editing forms one part of a broader research reporting process.
A complete workflow can include data analysis, statistical review, report writing, editing, visualisation, fact-checking, formatting, and publication.
The writing stage needs to remain connected to the evidence stage. Editors need access to the original findings, tables, definitions, and methodological notes required to verify rewritten statements.
For organisations producing recurring research, a reporting style guide can define preferred terminology, rounding conventions, percentage formatting, statistical explanations, and section structures.
This creates consistency across reports and reporting periods.
Businesses assessing professional research and reporting support can also explore research and reports services to understand how plain-English writing and editing can fit within a broader reporting workflow.
What is the key principle for accurate plain-English statistical reporting?
The key principle is to simplify the language without simplifying the evidence. Accurate reporting retains the numbers, definitions, relationships, uncertainty, and scope that determine meaning while presenting them in direct language suited to the intended business audience.
Plain English and statistical accuracy serve different functions.
Plain English determines how clearly information is communicated. Statistical accuracy determines whether the communication remains faithful to the evidence.
Effective research reporting requires both.
A technically correct report can still create confusion through unnecessary terminology. A highly readable report can also become inaccurate if editing removes statistical qualifications or changes the meaning of results.
The strongest approach treats every sentence as an evidence statement. The language can become simpler, but the underlying measurement remains unchanged.
For UK business research, this creates a clear path from technical analysis to accessible reporting. The result is a report that communicates measurable findings directly while preserving the statistical information required for responsible interpretation.
FAQs
Q1: How do you translate technical findings into plain English without losing statistical accuracy?
Ans: Preserve the original statistical meaning, figures, confidence intervals, and limitations while replacing complex terminology with clear language. Plain-English research writing should simplify the explanation, not alter the underlying evidence.
Q2: What should a research report include when explaining statistical findings?
Ans: A clear report section should explain the key result, relevant statistics, context, and limitations in language appropriate for the intended audience. Technical findings should remain traceable to the original data and analysis.
Q3: How can statistical terminology be simplified in a business research report?
Ans: Define essential statistical terms in plain English and explain what the result means for the research question. Avoid replacing precise statistical concepts with vague wording that could change their meaning.
Q4: Why is plain-English writing important for technical research reports?
Ans: Plain-English writing helps business readers understand complex research findings without requiring advanced statistical knowledge. It can improve clarity while retaining the accuracy and limitations of the underlying analysis.
Q5: Can Times Intelligence Media Group help make technical research findings easier to understand?
Ans: Times Intelligence Media Group can support research and report writing by translating complex findings into clear, plain-English sections while retaining important statistical details. The process should preserve the evidence, methodology, and stated limitations of the original research.