

A display advertising ROI report template is a standardised document that captures campaign spend, outcomes, and calculated returns to support internal decision-making within UK brands. It quantifies investment, revenue attribution, and efficiency to compare channels, teams, and time periods.
A template defines required metrics, data sources, calculation methods, and visual layouts. UK brands use templates to ensure consistent reporting across markets and media owners. Consistency enables month-over-month and year-over-year comparison, supports budget reallocation, and provides audit-ready records for finance teams. A clear template reduces time spent on manual reconciliation and improves governance when stakeholders require verified figures.
Key entities are campaign, impression, click, conversion, spend, attributed revenue, and return on ad spend (ROAS). A campaign is the named advertising effort. Impression counts each ad view. Clicks record user interactions. Conversion records a completed desired action, such as a sale or lead. Spend is the gross media cost. Attributed revenue is revenue assigned to the campaign by the chosen attribution model. ROAS equals attributed revenue divided by spend. UK brands typically report in GBP and use monthly reporting cycles.
How do you define the scope and objectives for a display advertising ROI report?
Define campaign objectives, reporting period, primary KPIs, and attribution model before collecting data for accurate ROI measurement. These choices determine which metrics appear in the template and how results are interpreted by stakeholders.
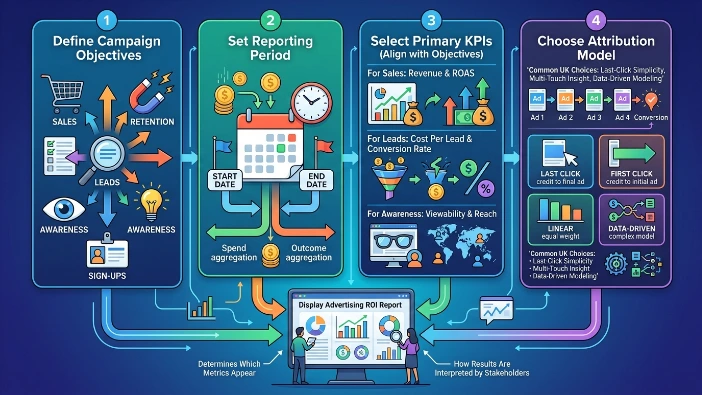
Objective setting specifies whether the campaign targets sales, leads, sign-ups, awareness, or retention. The reporting period sets boundaries for spend and outcome aggregation. Primary KPIs align with objectives: for sales use revenue and ROAS, for leads use cost per lead and conversion rate, for awareness use viewability and reach. Attribution model selection (last click, first click, linear, time decay, data-driven) defines how conversions map to touchpoints. UK brands commonly use last-click for simplicity, multi-touch for nuanced insight, and data-driven when available from platform-level modelling.
Specify currency, VAT treatment, and whether agency fees are included. Clarify whether view-through conversions count. Document these decisions in the template header so readers interpret figures correctly. This reduces disputes during internal review and facilitates comparisons across business units.
How do you collect and validate data for campaign ROI calculations?
Collect raw data from ad servers, DSPs, analytics platforms, CRM systems, and e-commerce back-ends, then validate with reconciliation rules and sampling checks. Validation ensures accuracy and repeatability of reported ROI.
Data sources include ad platform reports (impressions, clicks, spend), web analytics (sessions, assisted conversions), CRM records (leads, customer value), and transactional systems (orders, revenue). Reconciliation rules align naming conventions, time zones, and campaign IDs. Perform row-level matching where possible and aggregate to the reporting period. Apply de-duplication for clicks and conversions and exclude internal traffic using IP filters.
Validation steps include cross-checking spend totals against billing statements, comparing platform conversion counts with analytics conversions, and sampling sessions to confirm attribution linkage. Log any data gaps and quantify their impact. Record the last update timestamp and the person responsible for data pulls in the template for auditability.
How do you calculate ROI and related performance metrics for display advertising?
Calculate ROAS as attributed revenue divided by media spend; calculate incremental lift and cost-per-conversion metrics using consistent attribution rules. Use precise formulas to ensure comparability across campaigns.
ROAS = attributed revenue / media spend. Present ROAS as a decimal and percentage for clarity. Cost per conversion = media spend / attributed conversions. Conversion rate = attributed conversions / attributed clicks. View-through rate equals view-through conversions divided by impressions. Incrementality estimation uses holdout tests or geo-split tests; report incremental revenue and incremental ROAS separately from attributed ROAS.
When using multi-touch attribution, document the weighting schema and show both last-click and multi-touch ROAS for transparency. For long-sale cycles, include a lifetime value (LTV) window and show LTV-adjusted ROAS. In subscription models, report both first-transaction revenue and projected 12-month revenue per user as separate rows in the template.
What components should appear in a display advertising ROI report template?
A complete template contains header metadata, campaign summary, metric table, attribution notes, trend charts, and an interpretation section linking outcomes to decisions. Each component supports a specific stakeholder need: finance, marketing, or operations.
Header metadata includes brand unit, reporting period, currency, data refresh timestamp, person responsible, and defined attribution model. The campaign summary shows campaign name, objective, start and end dates, targeting summary, and creative formats. The metric table lists spend, impressions, clicks, conversions, attributed revenue, ROAS, cost per conversion, conversion rate, viewability, and view-through conversions. Attribution notes document rules, excluded traffic, and conversion windows. Trend charts illustrate spend versus revenue over time and ROAS trajectory. The interpretation section contextualises results and notes anomalies such as bid changes, creative rotations, or publisher outages.
Include a section for decisions driven by the results: reallocate budget, pause underperforming creatives, or expand high-ROAS placements. Link decisions to financial impact projections, with quantified expected change in ROAS or revenue.
How do you visualise ROI to make internal presentations effective?
Use clear time-series charts for spend and revenue, bar charts for ROAS by placement, and a single KPI summary at the top showing headline ROAS and budget variance. Visuals must match the reported numbers and use consistent scales.
A time-series chart plots daily or weekly spend and attributed revenue to reveal pacing and conversion lag. A bar chart ranks placements or publishers by ROAS to identify top-performing inventory. A KPI summary box presents total spend, total attributed revenue, ROAS, and cost per conversion. Include callouts for anomalies and shaded areas for promotional periods or tracking changes. Use consistent colour mapping and annotate the data source and update timestamp directly on the chart.
Provide downloadable CSV attachments for stakeholders who require raw data. Present both platform-reported and reconciled numbers side-by-side so finance and media teams see the same base data. Maintain a slide or one-page PDF that executives can review quickly and a detailed spreadsheet for analysts.
What governance and audit controls should UK brands include in the reporting process?
Include version control, access restrictions, data lineage documentation, and a reconciliation checklist to ensure auditability and compliance with UK data rules. These controls protect data integrity and support regulatory needs.
Version control tracks changes to the template and retains prior copies. Access restrictions limit edit rights to a small team and provide view-only rights for other stakeholders. Data lineage documents the origin of each metric, the transformation applied, and who performed it. The reconciliation checklist compares platform spend to billing statements, flags discrepancies, and requires sign-off. Retain reports for a minimum of six years for financial audit readiness where applicable.
Ensure compliance with UK data protection rules by documenting PII handling, anonymisation steps, and the lawful basis for processing. Where measurement uses third-party cookies, record consent mechanisms and any adjustments made due to browser changes or regulatory updates. For government-funded campaigns or regulated sectors, add an extra compliance sign-off from legal or privacy teams.
Explore More Expert Insights:
Banner Advertising Contract Essentials: What UK Brands Must Negotiate Before Signing
How Times Intelligence Delivers Verified Impressions Across Its UK News Network
What benefits do UK brands get from standardised ROI reporting?
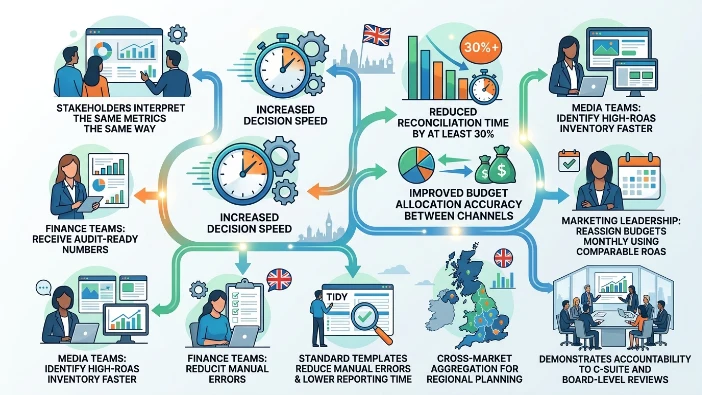
Standardised ROI reporting increases decision speed, reduces reconciliation time by at least 30%, and improves budget allocation accuracy between channels. It delivers consistent insight across departments.
With standardisation, stakeholders interpret the same metrics the same way. Finance teams receive audit-ready numbers. Media teams identify high-ROAS inventory faster. Marketing leadership uses comparable ROAS figures to reassign budgets monthly. Standard templates reduce manual errors and lower reporting time. Consistent reporting supports cross-market aggregation for regional planning and demonstrates accountability to C-suite and board-level reviews.
How do brands act on ROI findings to improve future campaigns?
Brands reallocate budget toward placements with highest ROAS, refine creative where conversion rates lag, and run controlled incrementality tests to validate channel value. Each action links to measurable changes in spend efficiency.
If a placement shows ROAS below target, reduce spend or negotiate price. If a creative has a low conversion rate but high impressions, test new messaging or formats. Run holdout or geo tests to measure true incremental revenue. Apply learnings to audience targeting and frequency caps. Update the template after tests to reflect refined attribution windows and revised LTV assumptions.
Discover More Insights:
How to Align Banner Creative With the Editorial Context of UK News Sections Provides guidance on aligning creative with editorial context to support performance uplift.
A rigorous display advertising ROI report template defines scope, sources, calculations, visualisations, and governance. UK brands that adopt a standard template improve reporting speed, support financial audits, and make clearer budget decisions. Use precise attribution rules, validated data, and clear visuals to present campaign ROI and drive evidence-based media allocation.
Explore the Complete Guide:
How the UK’s Second-Largest Ad Export Market Is Shifting Its Spend in 2026



