
The UK digital economy generated £20.4 billion in measured output in the latest national estimates. It comprises software and computing services, telecommunications, digital media, and platform activity, with software development and IT services contributing the largest single share.
The UK digital economy is the set of sectors and activities that produce digital goods and services, and those that use digital technologies to deliver value. National accounts classify digital output across software publishing, information services, telecommunications, and computer consultancy. Official statistics report employment, gross value added (GVA), export performance, and investment for these categories. Measured GVA of £20.4 billion excludes indirect digital enablement in manufacturing and services where digital tools increase productivity. This exclusion undercounts the economy-wide economic dependence on digital capabilities and distorts policy and investment signals.
Why is improved industry research necessary for the UK digital economy?
Improved industry research is necessary because current data underreports cross-sector digital activity, produces delayed insights, and prevents evidence-based policymaking, reducing the efficiency of investment, skills planning, and trade strategies across a £20.4 billion sector and its larger ecosystem.
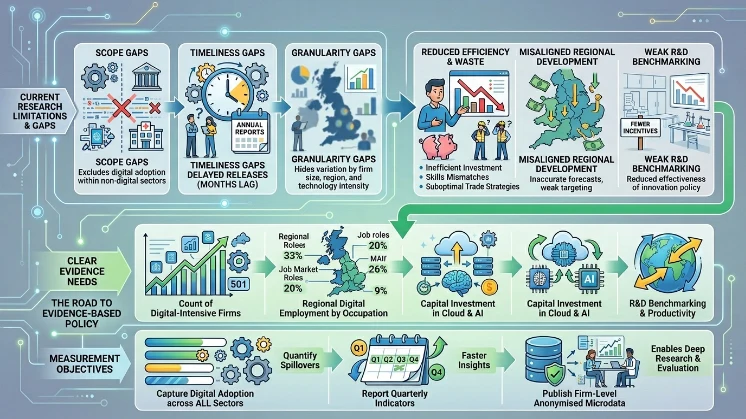
Existing datasets use narrow sector definitions and sparse firm-level surveys. These limitations create gaps in three areas: scope, timeliness, and granularity. Scope gaps exclude digitally enabled activity within non-digital sectors such as advanced manufacturing, finance, and healthcare. Timeliness gaps arise from annual reporting cycles and multi-month lags in official releases. Granularity gaps hide variation by firm size, region, and technology intensity. These gaps produce inaccurate labour forecasts, misaligned regional investment, and weak benchmarking for research and development (R&D) incentives. Improved research would quantify spillovers from digital to other sectors and make policy levers more targeted and effective.
How do current measurement methods undercount digital activity?
Current methods undercount digital activity by relying on static industry classifications, coarse survey questions, and incomplete taxonomies; they omit platform-mediated work, digital exports embedded in services, and capitalised software investments.
Industry classification systems such as SIC (Standard Industrial Classification) assign firms to single sectors. Firms that both manufacture goods and provide embedded software are recorded under one category, masking digital contribution. Surveys frequently ask binary questions about “digital adoption” without measuring intensity or outcome. Capital expenditure on software often falls under general IT spending categories and escapes R&D metrics. Platform-mediated work—cloud services, app stores, and marketplaces—creates value chains split across jurisdictions and appears fragmented in trade statistics. Improving measurement requires updating taxonomies, adding intensity scales to surveys, and integrating administrative data like VAT and payroll for higher-resolution estimates.
A manufacturing firm that sells networked medical devices records output as manufacturing rather than as combined manufacturing-plus-software services. An export recorded as consultancy may omit the digital delivery channel, reducing visibility of digital services trade.
What components should a robust industry research framework include?
A robust framework should include updated taxonomies, regular firm-level surveys, administrative data linkage, regional and occupational breakdowns, digital investment tracking, and open microdata for academic and policy analysis.
Taxonomy revision must reflect digital-native categories such as cloud platforms, AI development, cybersecurity services, and digital content platforms. Firm-level surveys should collect metrics on digital revenue share, software capitalisation, cloud spend, and workforce digital skill levels. Administrative linkages can use tax filings, payroll records, and export documentation to validate survey responses and reduce reporting burden. Regional disaggregation must align with devolved governance units to support local industrial strategies. Occupational breakdowns should map to skill frameworks to guide training and apprenticeship programmes. Open anonymised microdata enables independent validation and innovative research by universities and think tanks.
Robust governance needs legal frameworks for data sharing, strong anonymisation protocols, and independent oversight to maintain public trust. Clear data access tiers can balance researcher access with confidentiality.
What process should be used to collect and publish better digital-economy evidence?
Use a staged process: define updated classifications, pilot enhanced surveys, link and validate administrative records, publish quarterly indicators, and release anonymised microdata with documentation for reproducibility.
Step one defines a modern digital taxonomy with stakeholder input from statisticians, industry bodies, and academics. Step two pilots surveys sampling small, medium, and large firms across regions to refine questions on digital intensity and investment. Step three links survey responses to administrative records for verification and to improve coverage. Step four produces quarterly dashboards reporting GVA, employment, investment, and export indicators. Step five publishes research datasets and technical documentation to enable external analysis and citation.
A realistic timeline spans 18 months from taxonomy agreement to first quarterly release: 3 months for design, 6 months for piloting and linkage infrastructure, 6 months for rollout, and 3 months for initial reporting. Required resources include statistical staff, IT infrastructure, and data-sharing agreements with HMRC and ONS.
What measurable benefits will improved research deliver for the UK digital economy?
Improved research will deliver targeted skills planning, efficient R&D allocations, better investment attraction, accurate trade statistics, and stronger regional strategies; benefits quantify as higher productivity, fewer misallocated grants, and clearer growth forecasts for a £20.4 billion sector.
Better measurement aligns training programmes to occupational demand and reduces vacancy mismatches. R&D incentives will target high-impact activities when policymakers see where digital innovation concentrates. Investors use timely indicators to allocate capital to fast-growing subsectors, improving financing for scale-ups. Trade negotiators obtain accurate digital services export data to inform agreements. Regional bodies deploy resources for local infrastructure such as gigabit broadband where data shows constrained digital adoption. Over time, clearer evidence supports productivity improvements and higher tax revenues by strengthening high-value digital clusters.
Quantifiable levers include apprenticeship funding targeted by occupation gaps, R&D tax credit adjustments by digital-intensity metrics, and regional investment funds allocated by data-driven digital adoption indices.
Explore More Expert Insights:
Why UK B2B Buyers Read 5 Reports Before Speaking to Any Vendor
Original Research Gets 5× More AI Citations Than Opinion Pieces
What use cases will immediately benefit from better industry research?
Use cases include workforce development programmes, regional industrial strategies, export promotion, innovation policy targeting, and private investment decisions; each depends on granular firm-level and occupational data to reduce uncertainty and improve resource allocation.
Workforce development uses occupational breakdowns to set apprenticeship quotas and retraining initiatives. Regional industrial strategies use local digital intensity maps to justify infrastructure investment. Export promotion identifies high-performing digital services clusters for trade missions. Innovation policy targets R&D grants to firms with measurable digital product pipelines. Private investors use quarterly indicators and firm microdata to inform due diligence and venture allocation.
A local authority identifies a shortfall in cloud engineering roles and partners with colleges to fund specific courses. A national innovation fund reallocates grant budgets toward AI startups after data shows disproportionate R&D capitalisation in that sub-sector.
How should researchers and policymakers cite and use this evidence?
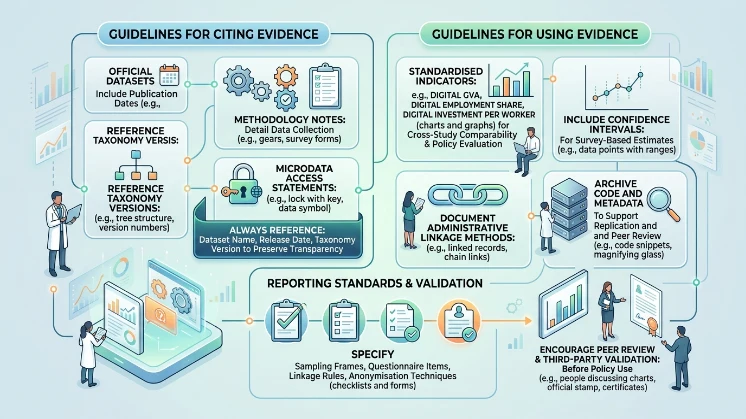
Cite official datasets with publication dates, include methodology notes, reference taxonomy versions, and use microdata access statements; use standardised indicators for cross-study comparability and policy evaluation.
When using evidence, always reference the dataset name, release date, and taxonomy version to preserve transparency. Include confidence intervals for survey-based estimates and document administrative linkage methods. Use common indicators—digital GVA, digital employment share, digital investment per worker—to enable comparability across studies. Archive code and metadata to support replication and peer review.
Adopt reporting standards that specify sampling frames, questionnaire items, linkage rules, and anonymisation techniques. Encourage peer review and third-party validation before policy use.
Read the Full Blog Here:
State of the Industry Reports: A 12-Month UK Content Visibility Study
Improved industry research is essential to accurately measure and support the £20.4 billion UK digital economy and its wider digital enablement across sectors. Updated taxonomies, enhanced surveys, administrative data linkage, and regular publication will produce the granularity, timeliness, and reliability needed for targeted skills policy, efficient R&D allocation, trade strategy, and investment. Implementing a staged process with clear governance and reproducible methods will convert limited visibility into actionable evidence for policymakers, researchers, and regional planners.
Find Out More:
Why 63% of UK Enterprise Brands Now Outsource Annual Report Production