

Deliver a concise, evidence-based narrative that links audience behaviour to business decisions, using 12 slides to align board-level priorities and recommend measurable actions. Each slide serves a targeted purpose: context, evidence, interpretation, or decision. Use verified data, clear metric definitions, and outcome forecasts. Focus on measurable outcomes such as reach, conversion uplift, and cost per acquisition. Time the deck for a 12–15-minute briefing plus discussion.
Which slide structure efficiently tells the audience insight story?
Use a structured sequence: executive summary, context and goals, methodology, key findings, implications, recommendations, and next steps across 12 slides. Slide 1 is the executive summary with three headline insights and expected KPIs. Slides 2–3 outline business context and marketing goals tied to revenue or audience targets.
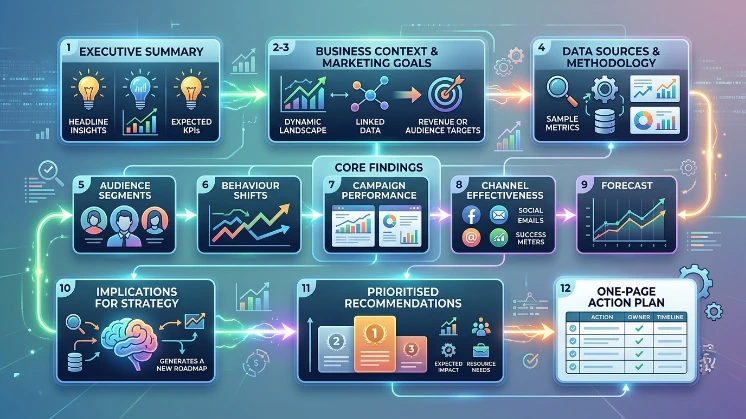
Slide 4 documents data sources and methodology with sample metrics. Slides 5–9 present core findings: audience segments, behaviour shifts, campaign performance, channel effectiveness, and forecast. Slide 10 synthesises implications for strategy. Slide 11 lists prioritised recommendations with expected impact and resource needs. Slide 12 gives a one-page action plan with owners and timelines.
What definitions and metrics must be explicit in the deck?
Define audience segments, intent categories, and metric formulas: sessions, conversion rate, revenue per session, and attribution windows. List audience segments with numeric criteria: e.g., mobile-first equals >60% sessions on mobile; repeat visitors equal >2 visits per 30 days. Define intent categories: informational, transactional, navigational, with example search queries.
Give metric formulas: conversion rate equals conversions divided by sessions; revenue per session equals total revenue divided by sessions. State attribution window length in days and number of touchpoints considered. Include last-checked timestamps for all datasets.
How should methodology and data quality be presented to a board?
Show data lineage, sampling, and limitations succinctly, with a visual indicator of confidence for each dataset. Name each data source: internal analytics, CRM, ad platforms, third-party panels, and transaction systems. Describe processing steps: deduplication, cohorting, and time-zone normalisation.
State sample sizes and date ranges. Flag known gaps such as cross-device identity loss or offline conversion lag. Use a confidence score per dataset: high (complete transaction data), medium (panel-derived estimates), low (small-sample surveys). Boards use these scores to weight recommendations.
Which core findings warrant direct focus in the presentation?
Highlight top three findings: a quantifiable audience shift, a channel performance delta, and a conversion friction point with associated metrics. Present each finding with a headline metric and a short evidence trail. “Mobile sessions rose 28% year-on-year; conversion rate on mobile lags by 1.8 percentage points; revenue per mobile session is £0.42 lower.” Use one chart per finding and include exact numbers and time periods. Follow each finding with a clear implication statement tied to revenue or cost.
How should visualisation and slide design prioritise clarity?
Use simple charts, one key metric per slide, clear labels, and a consistent colour palette tied to metric categories. Prefer bar charts and time-series lines with numeric callouts for the critical datapoint. Avoid multi-axis charts that confuse interpretation.
Use tables only for small datasets with up to five rows. Add a single sentence annotation under each chart that states the insight in numeric terms. Ensure fonts are legible for a boardroom screen and every slide includes source and date.
What components should recommendations contain?
Recommendations must include the action, expected impact with numeric estimates, required resources, and a risk rating for each item. Frame each recommendation with an expected KPI change: percentage lift in conversion, estimated revenue increase, and timeline to effect. State required resources: headcount, estimated budget, or data feeds.
Assign a risk rating: low, medium, or high, based on data confidence and operational complexity. Prioritise recommendations by impact per resource unit to aid board decision-making.
How to present financial implications and ROI clearly?
Show expected incremental revenue, cost, and payback period with scenario forecasts: conservative, base, and aggressive. Base each scenario on explicit assumptions: uplift percentage, conversion lag, and channel spend. Provide a simple table that lists incremental revenue, implementation cost, and payback in months for each scenario. Use absolute numbers in GBP and percentages for clarity. Highlight the base scenario as the recommended planning case and show sensitivity to key variables.
What governance and resourcing details belong in the action slide?
Specify owners, timelines, required data integrations, and success criteria for each recommended action. Provide a one-page action plan with named owner roles (e.g., Head of Audience, Analytics Lead), start and end dates, required integrations (CRM merge, server-side tagging), and success criteria with target KPIs. Include escalation points and a weekly reporting cadence during the first 90 days. Ensure board members can see who is accountable and how progress will be tracked.
How should risks and mitigations be framed for board-level review?
List the top three risks with measurable triggers and discrete mitigation steps tied to cost and timeline. For each risk, show the trigger metric and the mitigation action. Example risk: “Mobile checkout abandonment increases >5 percentage points”, trigger: month-on-month increase in mobile abandonment. Mitigation: Implement a one-step guest checkout and monitor a 14-day test. Attach cost estimates where relevant and indicate mitigation lead.
Explore More Expert Insights:
Audience Insights Service Pricing: What UK Brands Typically Invest and What They Get
From Data to Decision: How UK Brands Use Audience Insights to Plan Full-Year Buys
What are effective use cases to include as evidence of likely outcomes?
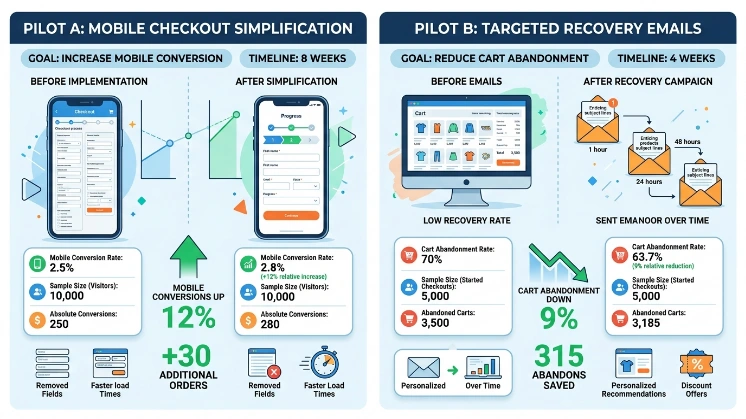
Include two to three brief case summaries with before-and-after metrics and timelines from comparable campaigns or pilots. Present a short case: pilot A increased mobile conversion by 12% in eight weeks after checkout simplification; pilot B reduced cart abandonment by 9% following targeted recovery emails over four weeks. Provide absolute numbers and the sample sizes. Use cases should mirror the recommended actions and validate the expected impact.
How should the deck conclude to secure board decisions?
End with a single-slide decision request listing choices, recommended option, required budget, and next meeting date for approval. List available options deferral, pilot, or full roll-out with estimated costs for each. State the board’s recommended option with expected ROI and timeline. Request a clear decision or approval to proceed to pilot. Provide a date for review of pilot results and a concise list of deliverables for the next meeting.
Learn More Here:
How the UK’s 30% E-commerce Retail Share Is Reshaping Audience Expectations
A 12-slide board deck must compress audience insight into clear evidence, tangible implications, and prioritised actions. Define metrics and data confidence. Present three headline findings with numeric support. Offer recommendations that include expected impact, resources, risks, and governance. Use simple visuals and one key metric per slide. End with a clear decision request and a timeline for accountability. This structure enables boards in the UK to evaluate audience insights against commercial objectives and to allocate budget with confidence.
For More Information, Explore:
Seasonal Audience Shifts on UK News Sites: A 12-Month Behavioural Calendar



