

A 12-month attribution study measures lead volume, lead quality, conversion rates, pipeline value, attributed revenue, and return on marketing investment (ROMI) from media partnership channels.
The study defines lead volume as the count of unique leads originating from partnership content during the 12-month window. Lead quality uses firmographic fit, engagement depth, and lead-score thresholds to classify leads as MQLs and SQLs. Conversion rates track progression from lead to opportunity and opportunity to closed-won. Pipeline value aggregates opportunity amounts associated with partnership-originated leads. Attributed revenue records closed deals with primary or multi-touch credit allocated to partnership touchpoints. ROMI divides attributed revenue in GBP by total partnership spend in GBP to produce a ratio. Measurement spans quarters to reveal seasonality and campaign timing effects.
How is the attribution study designed and which model defines credit allocation?
Design uses deterministic linking, cohort tracking, and a weighted multi-touch attribution model with monthly reporting and quarterly reconciliation.
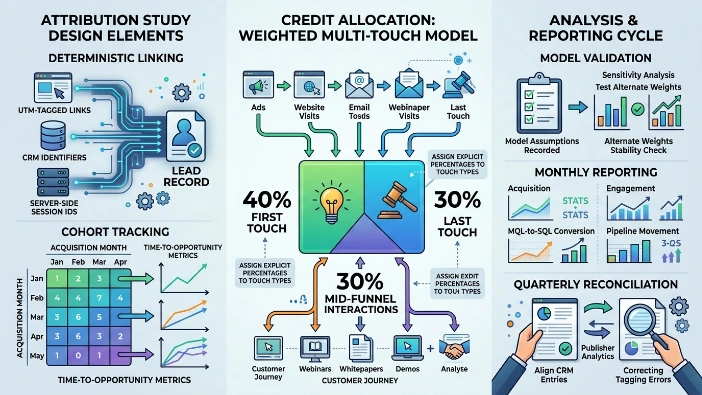
Deterministic linking requires UTM-tagged links, CRM identifiers, and server-side session IDs to connect web events to lead records. Cohort tracking groups leads by acquisition month to compare time-to-opportunity metrics across cohorts. The weighted multi-touch model assigns explicit percentages to touch types; in this study weights were 40% first touch, 30% last touch, and 30% distributed across mid-funnel interactions.
Teams recorded model assumptions and performed sensitivity analysis by recalculating with alternate weights to test stability. Monthly reports show acquisition, engagement, MQL-to-SQL conversion, and pipeline movement. Quarterly reconciliation aligns CRM entries with publisher analytics and corrects tagging errors.
What tracking and data sources are essential for accurate attribution?
Essential sources include publisher analytics, CRM records, marketing automation data, server-side event logs, and validated UTM parameters tied to deterministic IDs.
Publisher analytics supply page-level metrics: unique users, sessions, time on page, and referral sources. CRM systems store contact details, qualification status, opportunity stages, and closed-won revenue in GBP. Marketing automation platforms capture form submissions, lead scores, and email engagement timestamps. Server-side event logs preserve campaign metadata when client-side tags fail due to ad blockers or cross-domain redirects. UTM parameters encode campaign, medium, and content identifiers. Data pipelines ingest these sources into a reporting warehouse where join keys such as hashed email or CRM ID enable record linkage. Reconciliation scripts compare publisher counts to CRM entries and flag missing or inconsistent UTM tags for remediation.
What lead-quality components determine value in the study?
Lead quality uses firmographic fit, engagement depth, lead score thresholds, sales validation, and conversion to opportunity and closed-won status.
Firmographic fit includes company size bands (1–50, 51–250, 251–1,000, 1,001+ employees), industry codes, and UK geographical location. Engagement depth measures number of pages viewed, time on page, repeat visits, and content types consumed. Lead scoring assigns numeric points for behaviours: whitepaper download (+20), webinar attendance (+30), demo request (+50), multiple repeat visits (+10 each). Thresholds classify MQL at score ≥50 and SQL at score ≥80 with salesperson validation required for SQL status. Conversion to opportunity records entry to the sales pipeline; closed-won status logs revenue and deal size in GBP. The study reports distributions of lead quality and analyses correlations between initial score bands and eventual revenue.
What outcomes and performance metrics did the 12-month study report?
Outcomes included total leads, percentage MQLs and SQLs, median time-to-opportunity, pipeline value, attributed closed revenue, and ROMI by channel and content type.
Total leads were reported monthly and aggregated by quarter. MQL and SQL percentages show the share of leads meeting qualification thresholds. Median time-to-opportunity measured days from first contact to opportunity creation per cohort. Pipeline value summed opportunity amounts attributable to partnership leads in GBP. Attributed closed revenue recorded deals where partnership touchpoints received primary or multi-touch credit. ROMI presented as a ratio and percentage return on partnership spend. The study included confidence intervals and documented data reconciliation rates to indicate metric reliability.
Which content formats and placements produced the highest lead quality and conversions?
Long-form editorial features, co-branded webinars, and gated whitepapers produced higher SQL conversion and average deal size than short native ads or single social posts.
Long-form editorial features generated higher time-on-page and repeat visits, which correlated with increased lead scores and MQL rates. Co-branded webinars produced immediate high-intent leads with post-event demo requests; webinars yielded SQL conversion rates 2.5 times higher than display placements. Gated whitepapers captured contact data and initial qualification inputs; whitepaper leads had average lead scores 30% higher than ungated article readers. Short native ads and single social posts generated volume but lower average lead scores and lower conversion to SQLs. The study quantified per-format revenue-per-lead and cost-per-acquisition to inform budget allocation.
What attribution challenges appeared and what technical fixes were implemented?
Challenges included UTM stripping, cross-device fragmentation, and multi-channel credit ambiguity; fixes used server-side tagging, deterministic ID stitching, and model recalibration with sales input.
UTM stripping occurred when redirects removed parameters or when links were reshared without tags. Implementing server-side tagging preserved campaign metadata at the origin and ensured delivery to the reporting pipeline. Cross-device fragmentation occurred when prospects used multiple devices without authenticating; deterministic ID stitching used hashed email captures from gated assets to link sessions. Multi-channel credit ambiguity required periodic recalibration of weights and consultation with sales to adjust attribution for touch types that influenced deal closure. Post-fix audits documented reductions in unlinked leads and improved reconciliation rates between publisher and CRM records.
What contractual and operational practices improved attribution fidelity and outcomes?
Mandatory UTM governance, standardised landing pages with hidden campaign fields, contractual data-sharing clauses, and a joint KPI calendar improved measurement and lead handover quality.
UTM governance mandated consistent parameter naming conventions and required UTM presence on all published links. Standardised landing pages contained hidden fields that captured publisher ID and campaign tokens into CRM records, enabling deterministic mapping. Contracts included data-sharing clauses granting access to aggregated publisher analytics and raw event logs for audit purposes. A joint KPI calendar aligned content publication with sales campaigns and enabled coordinated follow-up sequences. These practices reduced data loss and improved quality of handovers between marketing and sales.
Explore More Expert Insights:
How Times Intelligence Media Group Partners Deliver 4M+ Monthly Unique Readers
UK Media Partnership Contracts: 11 Clauses Every Brand Lawyer Should Review
What financial and sales impacts did partnerships deliver over 12 months?
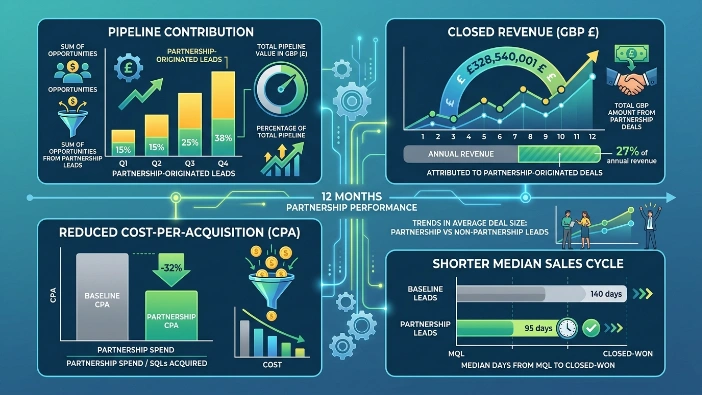
Partnerships contributed measurable pipeline value, closed revenue, improved cost-per-acquisition, and reduced median sales cycle for partnership-originated leads.
Pipeline contribution equals the sum of opportunities originating from partnership leads. Closed revenue recorded the total GBP amount attributed to partnership-originated deals. Cost-per-acquisition calculated partnership spend divided by SQLs acquired. Median sales cycle compared days from MQL to closed-won for partnership leads versus a baseline segment. The study reported percentage contribution of partnerships to total pipeline and to annual closed revenue, and tracked trends in average deal size for partnership leads compared with non-partnership leads.
How should organisations use the study findings to allocate future partnership budgets and contracts?
Use revenue-per-lead, quality-adjusted CPA, and ROMI to prioritise formats and publishers, then allocate budgets through phased pilots with contractual measurement guarantees.
Organisations should rank channels by revenue-per-lead and conversion efficiency. Prioritise formats that produced higher SQL conversion such as webinars and gated whitepapers. Allocate initial budgets to 3-month pilot runs with selected publishers, evaluate core KPIs monthly, and scale effective combinations. Contracts must include measurement clauses, UTM governance, and data-sharing obligations. Budget tranches should allow reallocation based on ROMI signals and quarterly performance reviews.
Explore More Expert Insights:
The Credibility Gap: Why UK Audiences Trust Editorial Partners Over Paid Ads
A 12-month UK attribution study for B2B lead generation through media partnerships delivers actionable evidence when it combines deterministic tracking, a weighted multi-touch model, rigorous data governance, and contractual measurement guarantees. The study quantifies lead volume, lead quality, pipeline contribution, and ROMI. It identifies formats that drive higher SQL conversion and recommends technical and contractual safeguards to preserve attribution fidelity. Organisations that apply these practices gain clearer visibility into partnership value and make evidence-led investment decisions.
Read More for Better Understanding:
8 Red Flags in UK Media Partnership Proposals You Should Never Ignore



