

Audience overlap analysis quantifies the shared audience between media partners to reveal duplication, unique reach, and efficiency for campaign planning.
Audience overlap analysis uses deterministic or probabilistic matching to measure how many users visit two or more publisher properties during a defined period. Deterministic matching uses logged-in identifiers or hashed emails. Probabilistic matching uses device and behavioural signals with confidence scores. The analysis reports absolute overlap counts, percentage overlap relative to each partner’s audience, and the unique-reach contribution of each partner. Typical time windows run 7, 28, or 90 days depending on campaign frequency. Analysts present overlap as a matrix and as decomposed metrics: total audience, exclusive audience, and shared audience. These outputs inform partner selection when three vendors compete for the same budget.
How do you define the measurement objectives before analysis?
Define three to five campaign objectives, set the conversion window, and select primary audience segments and performance metrics.
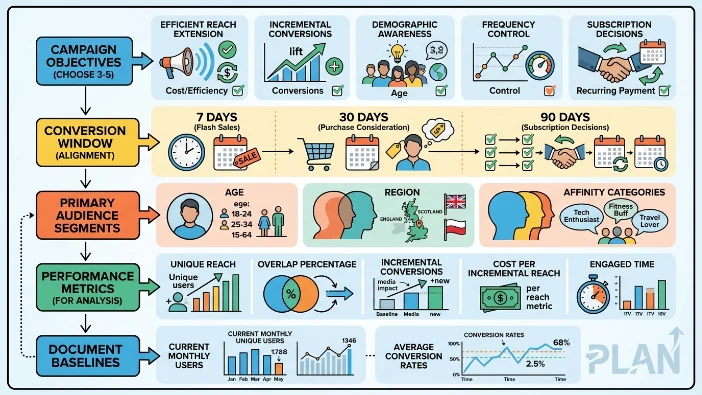
Start by listing objectives such as efficient reach extension, incremental conversions, frequency control, or awareness among a specific demographic. Choose a conversion window aligned to the buying cycle: 7 days for flash sales, 30 days for purchase consideration, 90 days for subscription decisions. Identify primary audience segments by age, region (for example, England, Scotland), and affinity categories. Select metrics for analysis: unique reach, overlap percentage, incremental conversions, cost per incremental reach, and engaged time. Document baselines: current monthly unique users and average conversion rates. Clear objectives and windows prevent mismatched interpretations and reduce rework during partner negotiations.
How is the data for overlap analysis collected and matched?
Collect first-party logs, tag-based event data, and consented identifiers; match records in a secure environment using hashed IDs or deterministic joins.
Data sources include publisher logged-in user databases, ad-server delivery logs, and client-side analytics events. Consent records from consent management platforms provide legal basis for use. Export hashed identifiers such as SHA-256 of emails or publisher-specific user IDs. Transfer data into a secure data clean room that supports privacy-preserving joins. Use deterministic joins where hashed identifiers exist. Where deterministic IDs do not exist, apply probabilistic matching using device graphs and cohort-based aggregation. Validate the matching approach through sample re-identification checks and measure match rate. Document match rate as a percentage of total records to show coverage limitations. All transfers obey UK GDPR and documented retention windows.
What metrics determine partner differentiation?
Key metrics include unique reach, overlap percentage, exclusive audience size, incremental conversion rate, and cost per incremental reach.
Unique reach measures distinct users exposed through a partner over the campaign window. Overlap percentage equals shared users divided by the partner’s audience. Exclusive audience size equals total audience minus shared users. The incremental conversion rate calculates additional conversions attributable to that partner versus the control. Cost per incremental reach divides spend by incremental unique users. Add engaged-time-per-user and share of voice in relevant content verticals. Use absolute numbers for audience counts and currency values for cost metrics. These metrics allow direct comparison between three competing partners and provide a basis for optimisation decisions.
How do you construct an overlap matrix for three partners?
Create a 3×3 matrix with pairwise overlaps and a three-way intersection; present absolute counts and percentages relative to each partner.
Rows and columns represent partners A, B, and C. Diagonal cells show each partner’s total audience. Off-diagonal cells show pairwise shared audiences: A∩B, A∩C, B∩C. A separate cell reports the three-way shared audience A∩B∩C. Report each intersection as absolute user counts and as percentage of the respective partner’s audience. For example, show A∩B = 120,000 users (24% of A, 18% of B). Include exclusive counts: users only in A, only in B, and only in C. Use the matrix to calculate total unique reach when combining any two partners or all three. This numerical clarity supports budget allocation decisions that target incremental reach or frequency consolidation.
How do you evaluate incremental value versus duplication?
Run a controlled incrementality test or apply modeled uplift using control cohorts, then compare converted users from partner exposure to expected baseline conversions.
Set up exposed cohorts for each partner and a shared control cohort with no exposure. Match control cohorts on demographics and prior purchase behavior. Measure conversion lift over the campaign window. If a partner’s exposed cohort produces conversions at a rate 40% higher than control, record uplift as 40%. Translate uplift into incremental conversions by multiplying uplift by exposed cohort size. Calculate cost per incremental conversion by dividing partner spend by incremental conversions. Compare this to cost per incremental reach. Use modeled uplift when control tests are infeasible, but document assumptions and confidence intervals. Incrementality quantifies true value beyond duplicated impressions.
How should cost and inventory quality factor into selection?
Normalise costs to cost per incremental unique user and weigh inventory quality by engaged time and content relevance for the target segment.
Collect price quotes for equivalent inventory types and compute cost per thousand (CPM). Combine CPMs with overlap and incremental metrics to produce cost per incremental unique user. Assess inventory quality using average engaged time, viewability rate, and placement context. For example, social-feed native placements often yield higher engagement time than banner inventory. Apply weightings that reflect campaign priorities: 60% weight to incremental cost when conversion-focused, 40% to engagement when brand-focused. This mathematical approach ranks partners on value rather than price alone.
When should a combination of two partners beat a single partner?
Choose two partners when their combined unique reach exceeds the single partner’s reach by at least 20% and combined cost per incremental user is lower.
Calculate combined unique reach after deducting overlap. If the combined unique reach is at least 20% greater than the largest single partner’s unique audience, and the combined cost per incremental user remains below the single partner’s cost, the combination provides better efficiency. Consider frequency: combining two partners reduces overexposure risk if overlap is low. Include a sensitivity check for overlap variance of ±5 percentage points to account for match uncertainty. Use these thresholds when allocating mixed budgets across partners.
How do contractual and operational factors affect partner choice?
Assess reporting transparency, data-sharing SLAs, editorial alignment, and cancellation or performance-clause terms before final selection.
Reporting transparency includes access to raw logs or aggregated reports, reporting cadence, and independent verification options. Data-sharing SLAs define latency, data refresh frequency, and match-rate guarantees. Editorial alignment covers allowed creative formats and content integration. Contract clauses specify cancellation penalties, performance thresholds, and remediation steps for missed KPIs. Operational friction increases time to launch and raises implementation costs. Score each partner on these dimensions using a simple rubric and incorporate the scores into final decision calculations.
Explore More Expert Insights:
8 Red Flags in UK Media Partnership Proposals You Should Never Ignore
How Recurring Media Partnerships Build Authority Faster Than One-Off Placements
What is a practical decision framework for choosing between three partners?
Score partners on five dimensions unique reach, incremental value, cost per incremental user, inventory quality, and operational readiness then rank by weighted total.
Assign weights aligned with campaign objectives. For example, conversion campaigns: unique reach 25%, incremental value 30%, cost per incremental user 25%, inventory quality 10%, operational readiness 10%. For each partner, assign numerical scores from 0 to 10 for each dimension based on measured metrics. Multiply scores by weights and sum to produce a weighted total. Compare single-partner totals and combination totals by recalculating metrics after overlap adjustment. Select the option with the highest weighted total. Document inputs and calculations for procurement and audit purposes.
What are common pitfalls and how to avoid them?

Common pitfalls include relying solely on reach metrics, ignoring match-rate limitations, and skipping incrementality testing; avoid them by validating match rates and running controlled tests.
Reach metrics overestimate value when overlap is high. Low match rates bias overlap estimates downward; always report match rate. Skipping incrementality testing confuses exposure with causation. Operational delays in data sharing introduce stale baselines. To avoid these pitfalls, require match-rate disclosure, run at least one controlled incrementality study for major buys, and include contractual SLAs for data delivery. This risk management ensures decisions rest on validated, comparable evidence.
Read the Full Blog Here:
From Transactional to Strategic: The Evolution of UK Brand-Publisher Deals
This framework turns audience overlap analysis into a repeatable, evidence-based selection process. The approach relies on measurable inputs: match rates, absolute user counts, uplift, and cost per incremental user. Use a short pilot to validate the matching approach, then scale the method to full campaigns and longer windows to optimise partner mixes across product lines and regions.
Click Here to Explore More:
Why Content Syndication Across 10 UK Sites Outperforms Any Single Placement



