
A state of the industry report is a structured, data-driven publication that summarises sector performance, audience reach, and content visibility over a defined period.
A report defines scope, methodology, and key metrics. In content visibility studies, scope includes channels (search, social, newsletters), time frame (12 months), and geographic focus (United Kingdom). Methodology lists data sources (Search Console, social analytics, and web traffic platforms), sampling frequency (daily, weekly, or monthly), and normalisation steps (timezone alignment and deduplication).
Key metrics include organic impressions, click-through rate (CTR), referral traffic, share of voice, backlink acquisition, and keyword ranking changes. Entities defined clearly in reports include publishers, audience cohorts (e.g., enterprise IT decision-makers), and content formats (long-form reports, blog posts, press releases). Example datasets include Google Search Console monthly queries, Twitter impressions per post, and referral counts from industry newsletters.
How do you design a 12-month content visibility study for the UK market?
Design a 12-month study by defining objectives, selecting datasets, standardising collection, and scheduling analysis checkpoints.
Begin with objectives: measure visibility change, identify seasonal patterns, and benchmark against competitors. Select datasets relevant to the UK: search engine results pages (SERP) data filtered by UK domain and country, UK social platform metrics, email newsletter open/click rates for UK recipients, and referral logs from UK publishers. Standardise collection by applying consistent date ranges (UTC vs. local), domain canonicalisation, and attribution models (last non-direct click for referral consistency).
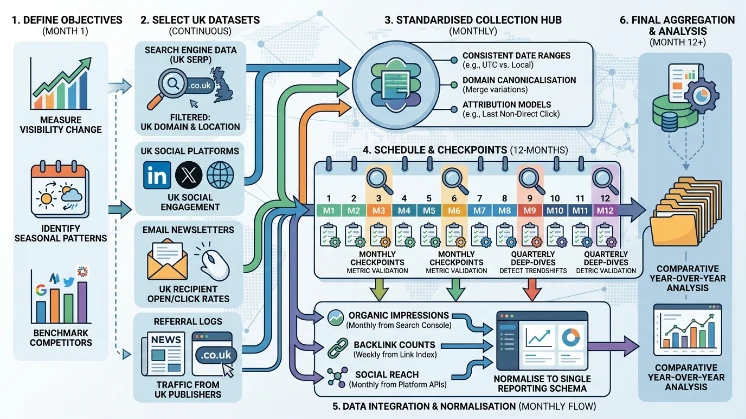
Schedule monthly checkpoints for metric validation and quarterly deep-dives to detect trend shifts. Include a final aggregation month for comparative year-over-year analysis. Collect monthly organic impressions from Search Console, weekly backlink counts from a link index, and monthly social reach from platform APIs, then normalise to a single reporting schema.
What components must the study include to be citation-ready and repeatable?
A citation-ready study includes an executive summary, methods section, raw dataset references, metric definitions, and reproducible code or query examples.
The executive summary states top-line findings and scope. The methods section lists data sources, extraction queries, API endpoints, and sampling cadence. Raw dataset references provide dataset IDs, date ranges, and anonymisation notes. Metric definitions explain calculations: organic impressions (total recorded SERP impressions), CTR (clicks divided by impressions), share of voice (brand impressions divided by total sector impressions), and visibility index (weighted sum of rankings and impressions). Reproducibility requires stored queries, anonymised sample rows, and versioned scripts (SQL, Python) with dependency lists and environment notes. Include data governance details: access controls, retention policy, and GDPR compliance steps for UK personal data. Example reproducibility item include the exact Search Console query used to pull impressions for uk site traffic.
What processes produce reliable visibility metrics over 12 months?
Reliable metrics result from automated data ingestion, monthly validation, anomaly detection, and standardised aggregation rules.
Automated ingestion uses scheduled API calls and log exports to reduce manual error. Monthly validation checks compare trends to server logs and third-party aggregators to confirm consistency. Anomaly detection flags spikes from isolated events such as a viral share or a syndicated distribution; flagged items receive manual review and tagging. Aggregation rules enforce deduplication of syndicated content and unify URL parameters. Attribution rules define how multi-channel exposure attributes conversions to visibility signals. Use time-series smoothing for monthly reports while preserving outliers in raw datasets. Automate daily Search Console pulls, run weekly deduplication on UTM-tagged referral links, and run monthly anomaly scripts to highlight non-recurring spikes.
What metrics and KPIs best measure UK content visibility and impact?
Primary KPIs include monthly organic impressions, CTR, average ranking position for target keywords, referral volume from UK publishers, and inbound link growth.
Organic impressions measure how often content appears in UK SERPs. CTR captures the propensity of impressions to convert to clicks. Average ranking position tracks keyword movement for target terms. Referral volume from UK publishers shows syndication and partner visibility. Inbound link growth measures authority and distribution reach. Secondary KPIs include dwell time, scroll depth for long-form reports, newsletter-open percentage for UK lists, and social engagement rates segmented by platform and UK audience. For competitive context, include share of voice and top content overlap with identified competitors. A 10% rise in organic impressions with stable CTR indicates improved SERP placement; a 20% increase in inbound links signals successful outreach.
What benefits arise from a 12-month UK content visibility study?
Benefits include longitudinal trend identification, evidence-based content prioritisation, clearer ROI attribution, and improved distribution strategies.
Longitudinal trends reveal seasonality and recurring campaign effects. Evidence-based prioritisation allocates resources to formats and topics that show sustained visibility gains. Clearer ROI attribution ties visibility gains to traffic and eventual conversions using consistent attribution models. Improved distribution strategies refine channel selection based on UK-specific referral and social performance. Stakeholders receive a factual basis for budget decisions and content planning cycles. Detecting that industry reports published in Q3 consistently produce 30% more backlinks over six months, prompting schedule realignment.
What use cases demonstrate the study’s value for UK enterprise teams?
Use cases include annual content planning, competitive benchmarking, investor reporting, and editorial calendar optimisation.
Enterprise content teams use the study for annual planning by identifying high-visibility content windows and formats. Marketing and competitive intelligence use benchmarking to compare share of voice against named competitors. Investor relations use visibility and engagement metrics to support external reporting and demonstrate thought-leadership reach. Editorial teams use topic and format performance to optimise the calendar, increasing content that yields sustained referral growth. An editorial team shifted budget to produce data-led whitepapers after the study showed whitepapers earned 2.5x more inbound links than op-eds over 12 months.
Explore More Expert Insights:
How to Commission a UK Industry Report That Becomes a Lead Magnet
Thought Leadership Reports: 8 Formats That Win UK Media Coverage
How should teams present findings to stakeholders for decision-making?
Present findings with clear top-line metrics, a methods appendix, prioritised recommendations, and month-by-month evidence tables.
Top-line metrics include visibility index change, organic impressions delta, and inbound link growth. Include a concise methods appendix with data source names, date ranges, and reproducibility steps for auditing. Prioritise recommendations by expected impact and resource cost, and attach month-by-month evidence tables for transparency. Use simple visualisations for trend clarity and include raw data extracts for technical teams. Provide an executive summary limited to single-page key findings and a technical annex for analysts. Example structure: one page of highlights, two pages of prioritised actions, and a technical annexe with query examples and sample rows.
What limitations and data governance issues must the report state?
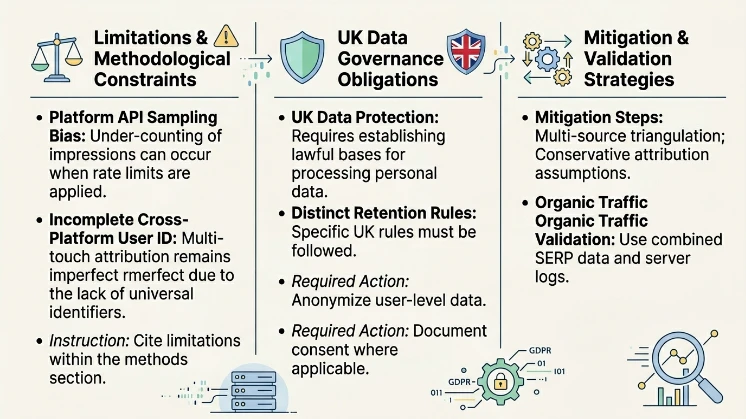
Limitations include sample bias from platform APIs, incomplete cross-platform user identification, and UK-specific data protection obligations.
Platform API sampling can undercount impressions when rate limits apply. Cross-platform identification lacks universal identifiers, so multi-touch attribution remains imperfect. UK data protection requires lawful bases for processing personal data and distinct retention rules; anonymise user-level data and document consent where applicable. Cite these limitations within the methods section and provide mitigation steps such as multi-source triangulation and conservative attribution assumptions. Use combined SERP data and server logs to validate organic traffic trends.
Learn More Here:
The £20.4bn UK Digital Economy Needs Better Industry Research: Here’s Why
A 12-month UK content visibility study requires explicit scope, reproducible methods, standardised metrics, and transparent limitations. The study supports planning, benchmarking, and reporting by providing month-by-month evidence and prioritised recommendations based on measurable KPIs. For teams seeking solution options, compare managed analytics platforms, in-house data engineering, and hybrid models to match available resources and technical skills.
For More Information, Explore:
Why 63% of UK Enterprise Brands Now Outsource Annual Report Production