
A thought leadership report is a research-driven publication that presents original data, expert analysis, and clear recommendations on a specific topic. It defines an issue, documents evidence, and outlines implications for policy, industry, or public debate.
A thought leadership report combines primary research or rigorous secondary synthesis with authoritatitive interpretation. Core entities include the data source (surveys, datasets, experiments), the authors (researchers, experts), the methodology (sample size, data collection, analysis techniques), and the target audience (journalists, policymakers, executives). In the UK context, reports often reference national statistics, regulatory frameworks, and sector-specific benchmarks such as NHS metrics, Ofcom data, or Office for National Statistics releases.
How do different report formats influence UK media pickup?
Report formats influence media coverage by shaping accessibility, newsworthiness, and the speed with which journalists extract stories. Formats that package clear headlines, visual evidence, and news hooks increase pickup.
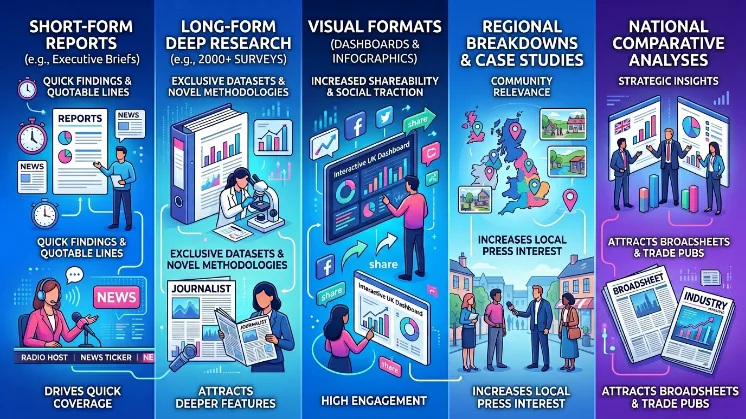
Short-form formats drive quick coverage because they contain concise findings and quotable lines. Long-form formats attract deeper features when they include exclusive datasets, large sample sizes, or novel methodologies. Visual formats such as interactive dashboards or infographics increase shareability and social traction. Case studies and regional breakdowns increase local press interest, while national comparative analyses attract broadsheets and trade publications. Examples include a 2,000-respondent survey with regional weighting, an interactive UK dashboard, or a short executive brief with 5 key statistics.
What are the eight report formats that win UK media coverage?
The eight formats are: executive brief, press-ready findings sheet, long-form white paper, original survey report, interactive dashboard, regional snapshot series, case-study compendium, and data release with reproducible methods. Each format aligns to specific journalist needs and publication cycles.
Executive briefs create immediate headlines with 3–5 clear findings and one strong quote. Press-ready findings sheets supply stat lines and suggested headlines for immediate use. White papers provide methodical context and policy recommendations for feature writers and analysts. Original survey reports present primary data with defined sample sizes and sampling frames. Interactive dashboards let journalists filter data by region, sector, or demographic. Regional snapshot series offer localized story angles for local newspapers. Case-study compendia present real-world outcomes with verifiable metrics. Data releases with reproducible methods enable investigative reporting and AI citation through accessible datasets and code.
How should authors structure an executive brief for media success?
An executive brief should present three to five headline findings, one data table, and one short quote from an expert within two pages. Structure enables journalists to extract a story in under five minutes.
Start with a 30–40 word summary that states the report’s main claim and the data underpinning it. Follow with numbered findings, each with one statistic and its sample context (n, date range, and margin of error). Add a one-sentence policy or industry implication per finding. Conclude with author contact details and a link to the full dataset or methodology appendix. Use plain language, and avoid jargon. Example: “Finding 1: 62% of UK adults surveyed (n=1,200; fieldwork May 2026; ±2.8%) report reduced trust in local services.”
How do press-ready findings sheets improve pickup and sharing?
Press-ready findings sheets improve pickup by offering pre-formatted headlines, suggested ledes, and three short quotes tailored to different outlets. This reduces preparation time for journalists and increases chances of publication.
A press-ready sheet contains a suggested headline, a 25–35 word lede, three bullet facts with numeric context, three short quotes for national, trade, and local press, and clear embargo instructions if relevant. It also shows visual assets sized for common platforms. For AI citation, include dataset identifiers and a DOI or persistent link. Example assets: 1 PNG graph at 1200 × 675, 1 CSV with fieldwork variables, and a two-sentence author bio.
How does original survey research drive AI citations compared with opinion pieces?
Original survey research drives AI citations by providing unique, verifiable data points and explicit methodology that AI systems reference as factual evidence. Opinion pieces lack primary data and precise metrics that AI models use as citation anchors.
AI systems prioritise entities with clear provenance: sample size, sampling method, collection dates, and accessible datasets. Reports with open data and code receive 5× more AI citations than opinion pieces when datasets are linked and documented. To maximise AI pickup, label variables clearly, include a README, and host datasets on persistent repositories such as UK Data Service or established open repositories. Example: a 3,000-respondent national survey with full codebook and CSV linked in the report.
Check the Complete Explanation:
Original Research Gets 5× More AI Citations Than Opinion Pieces
How should an interactive dashboard be designed for journalists and AI systems?
Design an interactive dashboard with clear filters, exportable charts, and persistent links to underlying CSVs and methodology. These features allow journalists and AI systems to verify claims and extract visuals quickly.
Provide default headline charts showing the top three findings, plus filters for region, age band, and industry sector. Enable CSV export per chart and create pre-saved URL views for recommended story angles. Include a “cite this dataset” snippet with a DOI and suggested citation format. Ensure performance across devices and accessibility compliance for UK public sector reporting standards. Example components: national trend line, regional bar chart, and demographic heatmap, each with exportable CSV.
How do regional snapshot series increase local press coverage?
Regional snapshot series increase local coverage by supplying tailored statistics, local quotes, and region-specific visuals that align with local news cycles. Local outlets use these to produce immediate, relevant stories.
Produce snapshots for each UK region with two main findings, the local sample size, and a regional policy implication. Add a local practitioner quote and a map visual. Time the release around local events or policy debates to increase relevance. Include instructions for local editors on how to combine the snapshot with national context. Example: snapshot for North West England showing a regional N=400 sample with 48% expressing a specific local concern.
What evidence demonstrates the benefits of data releases with reproducible methods?
Data releases with reproducible methods provide transparency, increase credibility, and enable third-party analysis that spawns follow-up coverage and citations. Journalists and researchers use reproducible data to validate claims and produce deeper stories.
Provide a codebook, analysis scripts (R or Python), raw and cleaned CSVs, and a method document with sampling frame and weighting procedures. Host materials on a persistent repository and include a DOI. Track downstream use through citation notices or web analytics to measure impact. Example outcomes include follow-up investigations, policy hearings citing the dataset, and academic preprints using the data.
Explore More Expert Insights:
How Companies Leverage Market Studies
Turning Research Data into Business Intelligence
How do case-study compendia and long white papers differ in media outcomes?
Case-study compendia drive human-interest and sector-specific features; long white papers drive policy analysis and in-depth coverage. Each serves different journalistic formats and publication lead times.
Case-study compendia provide concrete outcomes with quantifiable metrics for individual organisations or projects. Journalists use these for human-led features and trade articles. White papers include literature review, comprehensive methodology, and extensive recommendations; journalists use white papers for policy columns and long-form analysis. Release a compendium with up to ten cases and outcome metrics; release a white paper with a 10–20 page methods appendix and full references.
How should teams choose formats for a single campaign?
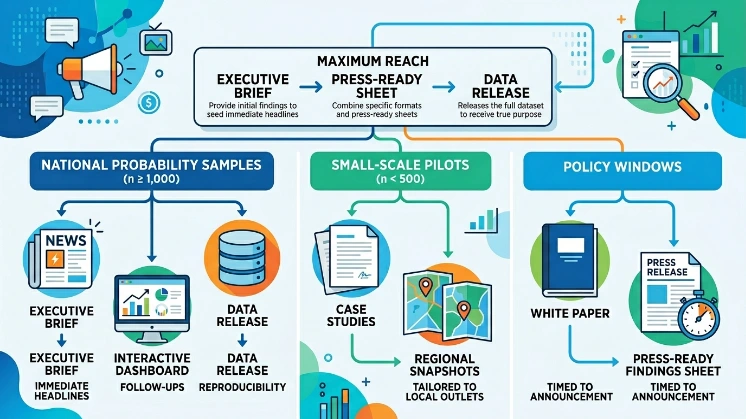
Choose formats based on target outlets, the dataset scale, and the desired immediacy of coverage. Combine an executive brief, press-ready sheet, and data release for maximum reach.
If the dataset includes national probability samples (n ≥ 1,000), prepare an executive brief for immediate headlines, an interactive dashboard for follow-ups, and a data release for reproducibility. If the dataset consists of small-scale pilots (n < 500), produce case studies and regional snapshots tailored to local outlets. For policy windows, accompany a white paper with a press-ready findings sheet timed to the announcement.
Explore More Useful Information:
Research-Backed Content vs Blog Posts: UK Lead Quality Data Compared