
Google Analytics is one of the most widely used measurement platforms in the United Kingdom. Publishers, marketers, and analysts rely on it to understand audience behaviour. However, many reader interactions never appear in standard reports. Privacy controls, cross-device activity, app usage, and content consumption patterns create large visibility gaps.
Understanding these gaps helps organisations build a more accurate view of audience behaviour and make better editorial and marketing decisions.
What does Google Analytics actually measure?
Google Analytics measures website interactions that occur within its tracking framework. It records page views, sessions, events, traffic sources, and user journeys. However, it only captures activity that can be identified, tracked, and processed within its measurement environment.
Google Analytics works by collecting data through tags placed on websites. When a visitor loads a page, the platform records information about that interaction.
Common metrics include:
- Page views
- Sessions
- Engagement rate
- Traffic source
- Conversion events
- Average engagement time
These metrics provide valuable information about website performance.
However, Google Analytics only measures activity that passes through its tracking systems. Any interaction that occurs outside those systems remains invisible.
Why is measurement limited?
Several factors restrict data collection:
- Browser privacy settings
- Cookie restrictions
- Ad blockers
- Consent preferences
- Cross-device behaviour
- Offline interactions
As privacy standards increase across the UK, these limitations become more significant.
Why is a large percentage of reader behaviour missing?
A substantial portion of audience activity occurs outside traditional analytics tracking. Readers move between devices, consume content through external platforms, block tracking technologies, and interact with content in ways that standard website analytics cannot fully capture.
Modern audience journeys are fragmented.
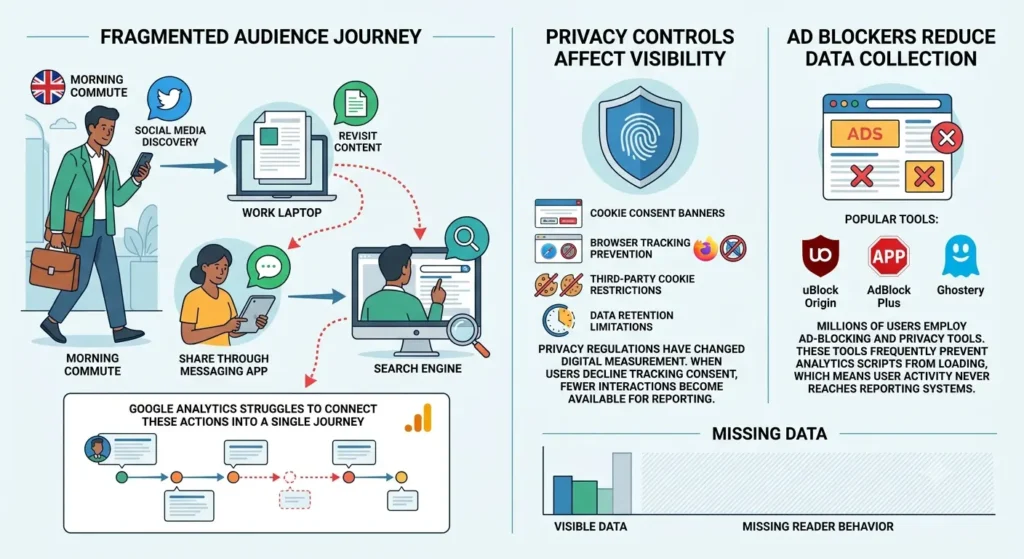
A UK reader may discover an article on social media during a morning commute, revisit it from a work laptop, share it through a messaging application, and return later through a search engine.
Google Analytics often struggles to connect these actions into a single journey.
How do privacy controls affect visibility?
Privacy regulations have changed digital measurement.
Examples include:
- Cookie consent banners
- Browser tracking prevention
- Third-party cookie restrictions
- Data retention limitations
When users decline tracking consent, fewer interactions become available for reporting.
How do ad blockers reduce data collection?
Millions of users employ ad-blocking and privacy tools.
Examples include:
- uBlock Origin
- AdBlock Plus
- Ghostery
These tools frequently prevent analytics scripts from loading, which means user activity never reaches reporting systems.
Which reader actions are commonly hidden from Google Analytics?
Many valuable audience signals remain outside standard reports. These include content sharing behaviour, cross-platform consumption, scroll patterns, attention quality, sentiment indicators, and interactions occurring within closed digital environments.
Not every reader action generates a measurable event.
Some of the most important hidden behaviours include:
Private sharing
Readers often share content through:
- Signal
- Telegram
These channels create significant traffic pathways that frequently appear as direct traffic or remain unattributed.
Cross-device reading
A user may:
- Discover content on mobile.
- Continue reading on desktop.
- Return later on tablet.
Without strong identity resolution, these activities appear as separate users.
Content attention
Time on page provides limited insight into true engagement.
Analytics systems cannot always determine:
- Whether content was actively read
- Whether readers skimmed headlines
- Whether users paused and returned later
Off-site discussion
Articles often generate discussion elsewhere.
Examples include:
- Social platforms
- Community forums
- Messaging groups
- Industry networks
These conversations influence audience behaviour but rarely appear in website analytics reports.
How does cross-device behaviour create reporting gaps?
Cross-device usage breaks traditional session tracking models. A single reader often uses multiple devices throughout the day, causing analytics systems to treat one individual as several unrelated users rather than one continuous audience member.
Cross-device consumption is standard behaviour in the UK.
A typical news consumer may use:
- Smartphone during travel
- Laptop during work hours
- Smart television in the evening
- Tablet before bed
What happens when identities cannot be connected?
Analytics platforms create separate records.
This affects:
- User counts
- Session counts
- Returning visitor calculations
- Conversion attribution
As a result, audience reports often overstate user volume while understating loyalty and engagement.
Why does this matter?
Audience development teams depend on accurate reader profiles.
Incomplete identity data affects:
- Subscriber analysis
- Content strategy
- Audience segmentation
- Retention planning
Understanding these limitations improves interpretation of analytics reports.
How do social platforms hide reader activity?
Social networks control large portions of audience discovery. Much of the engagement occurring within these environments never becomes fully visible inside website analytics platforms, creating incomplete pictures of referral performance and content influence.

Readers increasingly consume content within platform ecosystems.
Examples include:
- Social feeds
- Instant articles
- Video previews
- Embedded content experiences
What is dark social traffic?
Dark social refers to traffic that originates from private sharing channels but lacks clear referral information.
Common sources include:
- Messaging applications
- Email forwarding
- Private communities
This traffic often appears as direct visits despite originating elsewhere.
Why is social engagement difficult to measure?
A reader can:
- View a headline
- Read comments
- Save a link
- Share content
without visiting the original website.
Those actions influence audience behaviour but remain outside traditional analytics reporting.
Why does audience attention differ from page views?
Page views measure content access, while attention measures content consumption. These are different behaviours. A page view indicates loading activity, but attention reflects whether readers actually engaged with information presented on the page.
A page can receive thousands of visits.
That does not guarantee meaningful engagement.
What does a page view tell you?
A page view confirms:
- A page loaded
- Tracking activated
- A visit occurred
It does not confirm reading quality.
What does attention measurement examine?
Attention-focused analysis often considers:
- Active time
- Scroll depth
- Reading completion
- Interaction frequency
- Return behaviour
These indicators provide a more detailed understanding of audience engagement.
Why is this important for publishers?
Editorial teams need to know:
- Which stories retain readers
- Which topics generate loyalty
- Which content drives repeat visits
Page views alone cannot answer these questions comprehensively.
How do consent requirements affect analytics data?
Consent frameworks directly influence data availability. When users decline tracking permissions, analytics platforms lose visibility into portions of audience behaviour, resulting in incomplete datasets and reduced measurement accuracy.
Consent management has become a standard part of digital publishing.
Many UK websites now present visitors with tracking choices.
What happens when consent is declined?
Several outcomes occur:
- Analytics cookies are restricted
- User identification decreases
- Session continuity weakens
- Attribution accuracy declines
This creates reporting gaps.
Why are estimates different from observed behaviour?
Analytics reports only represent measured users.
Untracked visitors still interact with content.
As a result, reported figures often differ from actual audience activity.
What data sources help reveal a fuller audience picture?
A more complete audience understanding requires combining multiple data sources. Website analytics, audience research, behavioural analysis, content engagement metrics, and reader segmentation data provide broader visibility than a single measurement platform alone.
No individual platform captures every audience signal.
Organisations often combine several approaches.
Audience research
Audience research examines:
- Interests
- Motivations
- Preferences
- Consumption habits
This adds context beyond website interactions.
Behavioural analysis
Behavioural analysis focuses on:
- Content journeys
- Topic engagement
- Reader frequency
- Retention patterns
These insights help explain why audiences behave in specific ways.
Audience segmentation
Segmentation groups readers based on shared characteristics.
Examples include:
- Loyal readers
- Casual visitors
- Topic enthusiasts
- Subscription prospects
This approach creates more actionable insights than aggregate traffic reporting.
Readers seeking a practical framework for audience segmentation can explore:
Building an Audience Persona From News Site Data: A Step-by-Step UK Framework
Organisations evaluating broader audience data ecosystems can explore:
News Site Audience Data vs DMP Platforms: A Head-to-Head UK Comparison
How can UK publishers interpret Google Analytics more accurately?
Google Analytics remains a valuable measurement platform, but its reports represent only part of the audience reality. Effective interpretation requires recognising visibility gaps, understanding missing behaviours, and combining analytics data with broader audience intelligence sources.
Analytics platforms provide useful measurement.
They do not provide complete measurement.
Dive Deeper With Our Expert Guides:
What 39.7M Social Posts Reveal About UK Audience Behaviour in 2026
UK Consumers Are Twice as Likely to Use Generative AI for Search as Americans
UK readers interact with content across devices, platforms, applications, and private channels. Privacy controls further reduce observable activity. As a result, a significant percentage of audience behaviour never appears in standard reporting dashboards.
Rather than treating analytics data as a complete representation of reader behaviour, organisations benefit from viewing it as one component within a broader audience measurement framework. This approach produces a more accurate understanding of how readers discover, consume, share, and return to content in the modern digital environment.