
A benchmark report is a structured, data-driven analysis that compares an organization’s performance metrics, strategies, and operational outcomes against industry standards, direct competitors, or past historical performance to identify market gaps and evaluate commercial competitiveness.
A benchmark report evaluates specific Key Performance Indicators (KPIs) to establish a baseline of operational success. Organizations collect primary and secondary data points across specific operational categories—such as digital traffic, audience engagement, customer acquisition costs, and brand sentiment. The resulting dataset provides clear, objective metrics that remove guesswork from strategic decision-making.
By establishing an accurate baseline, organizations measure progress over time. Benchmark reports contextualize raw data by placing individual brand metrics alongside sector averages. This comparison shows whether a brand outperforms, meets, or falls behind broader market trends.
Internal vs External Benchmarking
- Internal Benchmarking: Compares performance metrics within the same organization across different timeframes, business units, or geographical locations. For example, a retailer compares the Q1 online conversion rates of its London branch against its Manchester branch.
- External Benchmarking: Compares internal performance metrics against external organizations within the same sector. For example, a financial services provider compares its customer retention rate against the UK banking sector average.
Why Do UK Brands Need Benchmark Data Today?
UK brands need benchmark data to navigate economic volatility, track shifts in consumer behavior, evaluate market positioning against regional competitors, and allocate resources based on verified performance metrics rather than subjective internal assumptions.
The UK market presents specific regulatory, economic, and cultural dynamics that impact business performance. UK consumer spending patterns fluctuate due to changing inflation rates, shift patterns in household disposable income, and evolving digital purchasing habits. Reliance on global or generalized metrics leads to inaccurate forecasts. UK-focused benchmark data provides localized context that reflects precise regional operating conditions.
Benchmark data supports clear budget allocation across UK management teams. When leadership teams evaluate marketing channels, operational costs, or technology investments, comparative data reveals where capital generates the highest return. It prevents over-investment in mature channels that yield diminishing returns and highlights underfunded areas where competitors secure market share.
Key Factors Driving UK Benchmark Adoption
- Economic Fluctuations: Rapid shifts in input costs and consumer confidence require constant monitoring of sector-standard profit margins and customer acquisition costs.
- Regulatory Compliance: UK businesses operate under specific frameworks such as GDPR and the Consumer Duty regulation. Benchmarking operational compliance ensures organizations meet industry safety and privacy standards.
- E-Commerce Density: The UK maintains one of the highest e-commerce penetration rates in Europe. Brands require precise conversion, bounce, and cart abandonment benchmarks to remain competitive online.
What Are the Core Components of an Effective Benchmark Report?
An effective benchmark report contains a defined research methodology, precise data collection parameters, structured KPI comparisons, clear statistical distributions, contextual industry insights, and actionable strategic recommendations based strictly on verified quantitative metrics.
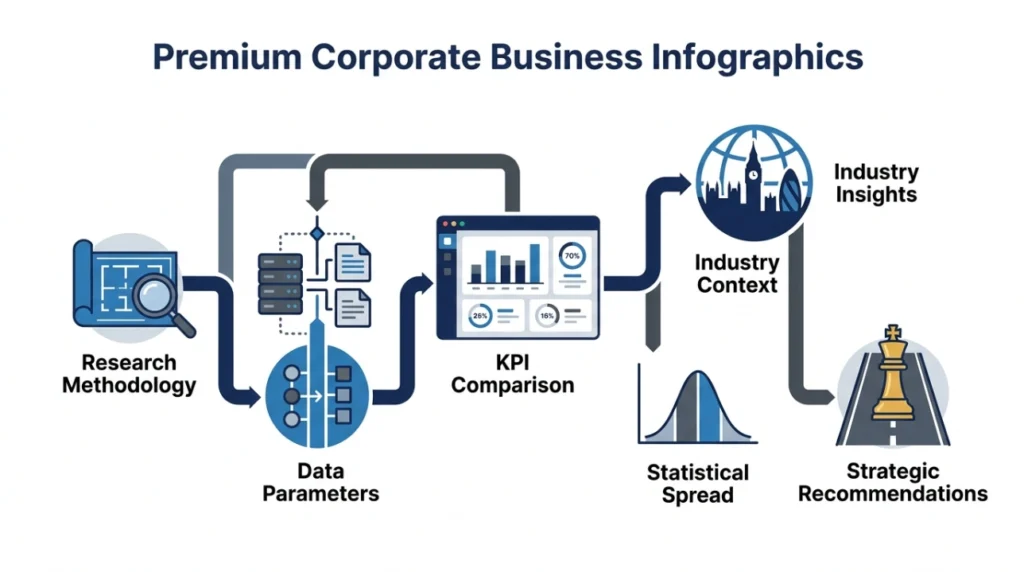
A standardized framework guarantees data integrity across every stage of the report. Without clear parameters, benchmark comparisons yield misleading conclusions that harm strategic planning.
Research Methodology and Sample Selection
The report outlines the exact scope of data collection. This includes the sample size, geographic distribution, industry sector classifications, and the precise timeframe of data collection. For example, a report studying B2B software companies might analyze data from 250 UK-registered organizations with annual revenues between £5 million and £50 million over a 12-month period.
Key Performance Indicator Selection
The report isolates specific, measurable metrics relevant to the target industry. Standard categories include:
- Financial Metrics: Profit margins, average order value (AOV), customer lifetime value (LTV), and revenue per employee.
- Digital Metrics: Website traffic volume, click-through rates (CTR), conversion rates, organic search rankings, and bounce rates.
- Customer Metrics: Net Promoter Score (NPS), customer retention rates, churn rates, and resolution times for customer support inquiries.
Data Visualization and Comparative Analysis
The data is organized into tables, distribution charts, and percentile rank models. Displaying lower quartile, median, and upper quartile performance levels allows brands to pinpoint their precise standing within their peer group.
Explore More Expert Insights:
How Online Retailers Recover Abandoned Carts Using Banner Advertising
How E-commerce Stores Boost Sales Using Retargeting Banner Ads
How Is a Benchmark Report Produced Step by Step?
A benchmark report is produced by defining precise research objectives, selecting relevant performance metrics, collecting validated data from target sample groups, analyzing performance variances, and compiling structured findings for distribution.
Producing a reliable benchmark report follows a rigorous, repeatable process to maintain data accuracy and analytical clarity.
- Objective Setting: Project managers establish the central research question, identify the target audience, and select the specific operational areas required for measurement.
- Metric Standardization: Analysts define explicit formulas for every metric included in the study. Standardizing formulas ensures that all participating entities provide equivalent data points.
- Data Collection: Researchers gather primary data through surveys, direct platform integrations, and anonymized corporate submissions. Secondary data is gathered from public financial registries, government databases, and trade association publications.
- Data Verification and Cleaning: Data scientists screen raw data inputs to remove duplicate entries, correct reporting errors, and eliminate extreme statistical outliers that distort average values.
- Statistical Analysis: Analysts run descriptive statistics to calculate sector medians, averages, and quartile ranges across each selected key performance indicator.
- Reporting and Documentation: Writers and data analysts structure the findings into clear visual formats, highlighting key variances between top-performing organizations and sector averages.
What Are the Primary Types of Benchmark Studies?
The primary types of benchmark studies include performance benchmarking, competitive benchmarking, strategic benchmarking, and process benchmarking, each targeting distinct areas of organizational management and market analysis.
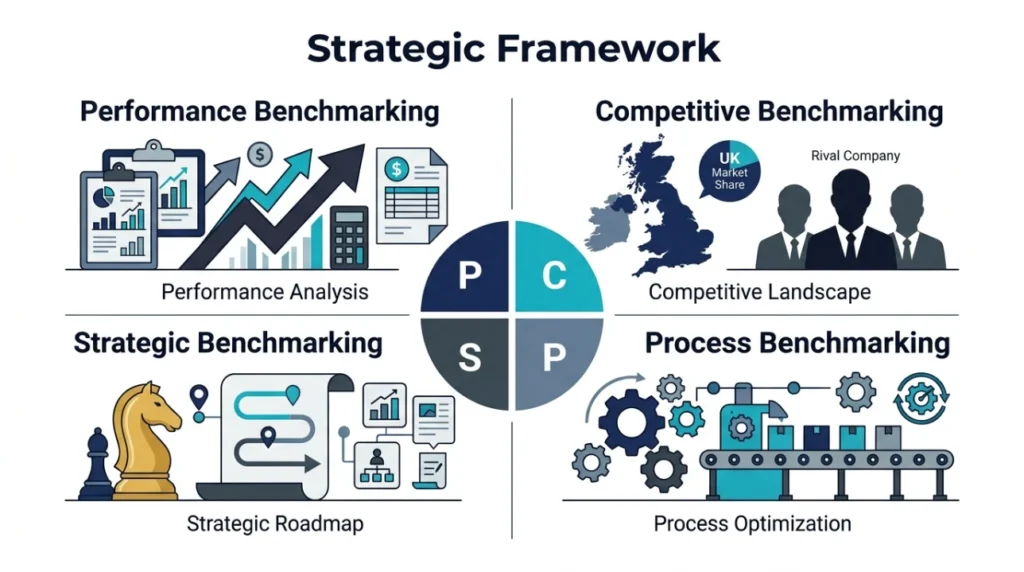
Organizations select specific benchmark types based on immediate operational priorities and broader strategic goals.
Performance Benchmarking
This study measures numeric outcomes, operational metrics, and financial results. It tracks quantitative metrics such as customer acquisition costs, inventory turnover rates, and digital ad conversion rates. Organizations use performance benchmarking to identify immediate quantitative performance gaps.
Competitive Benchmarking
Competitive benchmarking evaluates the specific products, services, processes, and digital footprints of direct market competitors. This study analyzes public metrics—such as social media engagement rates, search engine visibility, price points, and public customer satisfaction ratings—to assess relative market power.
Strategic Benchmarking
Strategic benchmarking examines long-term business models, growth strategies, and market entry tactics across successful peer organizations. This study goes beyond operational metrics to evaluate how market leaders allocate capital, adopt new technologies, and structure corporate governance to achieve sustained growth.
Process Benchmarking
Process benchmarking maps specific operational workflows, supply chain paths, and service delivery methods against industry best practices. It measures efficiency variables such as manufacturing cycle times, customer onboarding duration, and technical support resolution speeds.
How Do UK Companies Use Benchmark Reports to Drive Growth?
UK companies use benchmark reports to justify capital expenditure, optimize digital marketing campaigns, refine pricing structures, improve operational efficiency, and establish credible thought leadership within their specific business sectors.
Integrating benchmark data into executive decision-making eliminates operational blind spots and aligns cross-departmental teams around verified market realities.
Optimizing Operational and Marketing Investment
When marketing teams manage multi-channel budgets, benchmark data reveals whether performance metrics meet industry standards. For example, if a UK retail brand achieves a 1.5% conversion rate on paid search while the sector benchmark sits at 3.2%, leadership targets user experience optimization rather than increasing ad spend.
Boardroom Reporting and Investor Relations
Executive teams use benchmark reports to present objective performance reviews to board members, investors, and stakeholders. Demonstrating that an organization operates in the top quartile for customer retention or profit margin provides clear evidence of effective management and reduced operational risk.
Establishing Market Authority
Publishing or contributing to proprietary benchmark reports positions an organization as a primary source of sector intelligence. Media outlets, industry analysts, and commercial buyers cite authoritative benchmark data, generating organic brand visibility and market credibility. Brands looking to gain press coverage learn how to build a benchmark report that journalists regularly reference.
Summary of Key Takeaways
A benchmark report serves as an essential tool for objective self-assessment and market analysis. By measuring operational, financial, and marketing metrics against sector standards, UK organizations identify strategic inefficiencies, adapt to economic shifts, and direct capital toward high-growth opportunities. Whether evaluating internal performance or tracking competitive dynamics, standardized benchmark data provides the clear, empirical foundation required for sustained commercial success. Companies seeking specialized insight can explore options provided by professional analytics firms offering custom research and benchmark reports.