
A benchmark report for UK Media is a data-driven publication that evaluates industry standards, performance metrics, and trends across specific sectors. Journalists cite these reports because they provide objective evidence, proprietary data points, and clear statistical comparisons.
A benchmark report serves as an authoritative reference document within a specific sector. Media outlets rely on structured research to validate news stories, support editorial claims, and illustrate macroeconomic or industry shifts. In the United Kingdom, publications such as The Financial Times, The Telegraph, and trade-specific outlets require high-grade statistical methodology before referencing third-party data.
The Role of Benchmark Data in PR
Data-driven public relations relies on primary research to generate news value. A standard press release lacks the objective authority required by national and trade journalists. A benchmark report provides the following core media assets:
- Statistical Baselines: Quantitative reference points that measure average performance across an industry.
- Longitudinal Trends: Data points gathered over fixed intervals to demonstrate growth, decline, or stagnation.
- Comparative Indicators: Metrics that highlight performance variances between different business sizes, regions, or sectors.
Understanding the foundational concepts of data publishing helps organizations transition from basic content creation to strategic research production. Readers seeking an introduction to data publishing fundamentals can review the benchmark report definition.
Why Do UK Journalists Cite Industry Benchmark Reports?
UK journalists cite industry benchmark reports because they offer exclusive primary data, reduce research time, and provide verifiable proof for editorial claims. Independent data sources strengthen story credibility and fulfill editorial standards set by newsroom guidelines.
National and trade newsrooms in the United Kingdom operate under tight deadlines and reduced editorial staff. Journalists require pre-validated data to support news stories without spending days conducting primary research.
Editorial Standards and Source Verification
UK media institutions enforce strict guidelines regarding data citation. To earn a citation, a benchmark report must satisfy three core editorial criteria:
- Methodological Transparency: The publication must state the exact sample size, collection period, and demographic breakdown.
- Commercial Neutrality: The findings must reflect objective research rather than promotional product claims.
- Regional Relevance: Data must specifically isolate UK-specific sample groups, regional economic factors, or local regulatory impacts.
When a report meets these standards, journalists use the statistics to build headlines, construct infographics, and back up expert commentary.
How Do You Plan a Benchmark Report for the UK Market?
You plan a benchmark report for the UK market by defining a precise industry focus, selecting measurable key performance indicators, establishing a representative sample size, and aligning the survey timeline with national media agendas.
Effective report planning prevents methodology errors that disqualify data from media coverage. A structured planning phase ensures the final report contains statistics that align with current journalistic interests.
Step 1: Define the Research Scope
Select a specific sector or operational challenge. Broad topics fail to produce actionable headlines. Focus on specific operational verticals, such as B2B SaaS churn rates, UK retail supply chain delays, or commercial property energy efficiency metrics.
Step 2: Establish the Sample Parameters
UK national outlets generally require a minimum sample size of 1,000 UK consumers for B2C reports, or 200 to 500 C-suite executives or domain experts for B2B reports. The sample must reflect geographic distribution across England, Scotland, Wales, and Northern Ireland to support national news angles.
Step 3: Select High-Value Metrics
Identify metrics that reveal clear operational gaps, industry averages, and emerging trends.
| Metric Type | Example Data Point | Media Relevance |
| Performance Averages | Average customer acquisition cost in UK fintech | Establishes baseline standards |
| Financial Allocations | Percentage of revenue spent on AI integration | Reveals investment shifts |
| Operational Friction | Hours lost per week to regulatory compliance | Highlights industry challenges |
| Future Projections | Percentage of CFOs planning UK workforce expansion | Predicts economic direction |
What Is the Step-by-Step Process to Build a Benchmark Report?
The process to build a benchmark report involves designing unbiased survey questions, collecting data through verified channels, analyzing the results for statistically significant anomalies, and formatting the findings into a clear narrative layout.
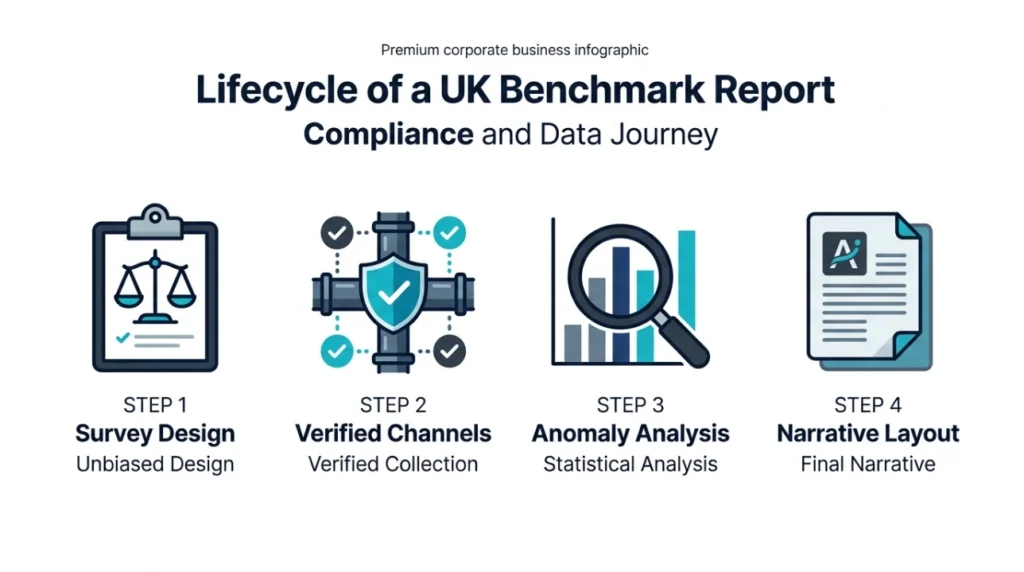
Executing a benchmark research project requires strict adherence to data gathering standards to maintain integrity throughout the production lifecycle.
Data Collection and Survey Design
Survey questions must use neutral phrasing to prevent bias. Avoid leading questions that force a specific outcome. Use closed questions with standardized numerical scales, ranges, or multi-choice options to generate clean quantitative data.
- Primary Surveys: Quantitative questionnaires distributed to verified industry panels.
- Telemetry Data: Anonymized user performance data extracted directly from software platforms.
- Public Records Integration: Combining survey results with data from Companies House, the Office for National Statistics (ONS), or regulatory bodies.
Data Cleaning and Analysis
Filter the raw data set to eliminate incomplete responses, bot submissions, and statistical outliers. Cross-tabulate responses by company size, annual revenue, job title, and geographic region. Segmenting data uncovers secondary news angles that appeal to specialized trade publications.
Explore More Expert Insights:
Headlines for Sponsored Articles: 9 Formulas That Drive UK News Reader Clicks
Sponsored Content Calendar Planning: A 12-Month UK Framework for B2B Brands
What Components Must a Media-Ready Benchmark Report Include?
A media-ready benchmark report must include an executive summary, a clear methodology section, high-contrast visual charts, segmented data breakdowns, and actionable industry takeaways presented in a downloadable PDF structure.
Organizing the report layout allows journalists to find key statistics within seconds of opening the document.
Executive Summary
The executive summary summarizes the most important data points on a single page. Present findings as key bullet points supported by exact percentages and financial figures. Journalists often pull quotes and core figures directly from this section.
Data Visualizations
Data visualizations must use clear labels, high-contrast colors, and standardized scale axes. Avoid complex graphic designs that obscure the data. Include simple bar charts, line graphs, and comparison tables that newsrooms can reformat or embed directly into digital news articles.
The Methodology Section
Position the methodology section clearly at the end of the report or within an appendix. Explicitly state the following details:
- Total number of respondents ($N$)
- Data collection dates (e.g., January 10, 2026 – February 15, 2026)
- Respondent qualifications and verification methods
- Margin of error and confidence intervals
How Do You Pitch a Benchmark Report to UK Journalists?
You pitch a benchmark report to UK journalists by writing targeted press releases, offering exclusive data access to key publications, creating custom statistics for specific beats, and pitching directly to newsroom editors.
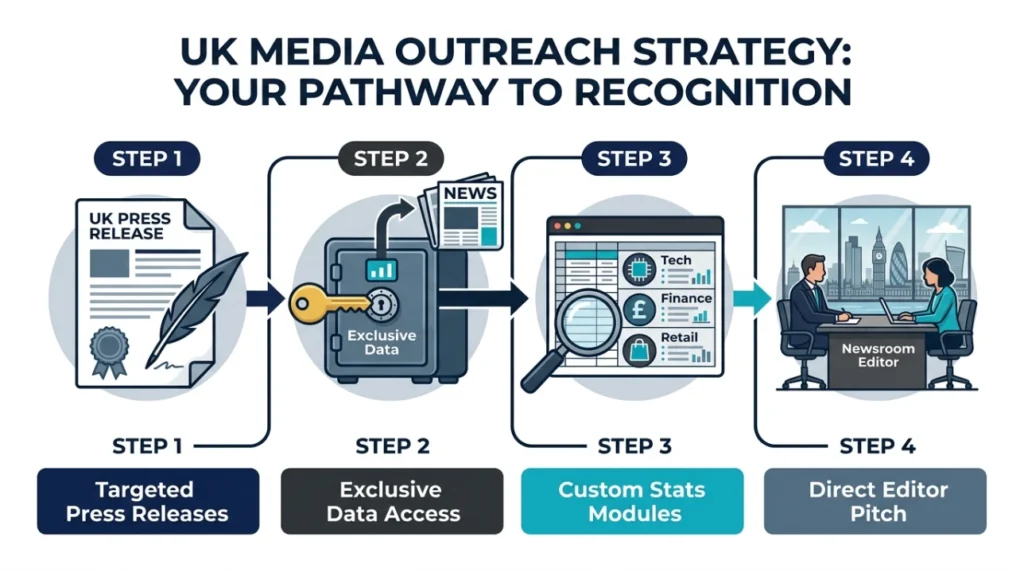
Data generation is only half the process; distribution determines the total volume of media citations.
Pitching Strategies for UK Media Outlets
Different media tiers require distinct pitching approaches. Tailor the distribution strategy according to target coverage goals.
- The Exclusive Offer: Offer the complete report and exclusive national commentary to a single high-tier publication (such as The Times or BBC News) 48 hours before general release.
- Trade-Specific Segmentation: Extract specific sub-data sets for niche publications. For example, pitch human resources statistics from the master report to HR trade magazines.
- Data Snippet Outreach: Send short, targeted emails containing three high-impact statistics directly to beat reporters covering relevant sectors.
Digital newsrooms require digital proof. Host the full report on a dedicated landing page featuring open-access PDF downloads, press kit graphics, and raw data files.
How Do You Turn Media Citations into Business Growth?
You turn media citations into business growth by placing media logos on your website, using cited statistics in mid-funnel sales collateral, running targeted digital ad campaigns, and converting report readers into sales leads.
Media citations build trust with potential customers evaluating solutions in your market sector.
Leveraging Citations in the Sales Funnel
When a major UK publication cites your benchmark report, convert that earned authority into measurable commercial outcomes:
- Sales Collateral: Insert media coverage quotes and benchmark charts into pitch decks, proposal templates, and enterprise sales presentations.
- Lead Generation Landing Pages: Require an email address to download the full benchmark report, converting high-intent research traffic into qualified leads.
- Account-Based Marketing (ABM): Send physical or digital copies of the report directly to target enterprise accounts as an authoritative educational resource.
Organizations seeking end-to-end execution support for primary research, report design, and media distribution can evaluate specialized external partners through the Time Intelligence Media Group services.
How Do You Measure the ROI of a Benchmark Report?
You measure the ROI of a benchmark report by tracking earned media placements, referral traffic from news sites, backlink domain authority growth, organic keyword ranking improvements, and total inbound sales leads.
Evaluating campaign success requires tracking both brand authority metrics and direct revenue impact.
Key Performance Indicators for Benchmark Campaigns
Track metrics across three distinct performance buckets to measure full-funnel effectiveness:
Earned Media Metrics
- Total print and digital media clippings
- Domain Authority (DA) of citing publications
- Share of Voice (SOV) compared to industry competitors
SEO and Digital Metrics
- Inbound referral traffic from news domains
- Direct organic search growth for branded research terms
- High-authority editorial backlinks gained
Commercial Metrics
- Total PDF downloads and gate conversions
- Pipeline revenue influenced by benchmark content assets
- Conversion rate improvements on sales pages featuring media trust badges
A well-executed benchmark report continues to generate citations and organic backlinks for 12 to 24 months following its initial release, producing a compounding return on investment over time.