

Average CPM across UK display inventory is £4.20, average viewability is 62%, and median CTR is 0.15%. Benchmarks vary by sector, device, and placement, with video-enabled display showing higher engagement and premium inventory commanding higher CPMs.
Benchmarks aggregate performance across programmatic and direct-buy inventory in the United Kingdom. CPM measures cost per thousand viewable impressions, viewability measures the share of impressions meeting the 50% for one second standard for display, and CTR measures clicks divided by served impressions. Benchmark values change with device mix and creative formats. Device splits in 2026 show desktop holding 28% of impressions, mobile 62%, and tablet 10%. Video-enabled display (in-banner video and native video units) raises engagement metrics and often increases CPMs by 40% to 120% compared with static banners. Use these headline numbers as starting points for sector-level adjustments and media planning.
How do benchmarks vary by sector in the UK?
Retail averages CPM £3.80, viewability 58%, CTR 0.18. Finance averages CPM £6.10, viewability 68%, CTR 0.12. Travel averages CPM £4.50, viewability 64%, CTR 0.14. News and publishing show higher CTRs but lower CPM predictability.
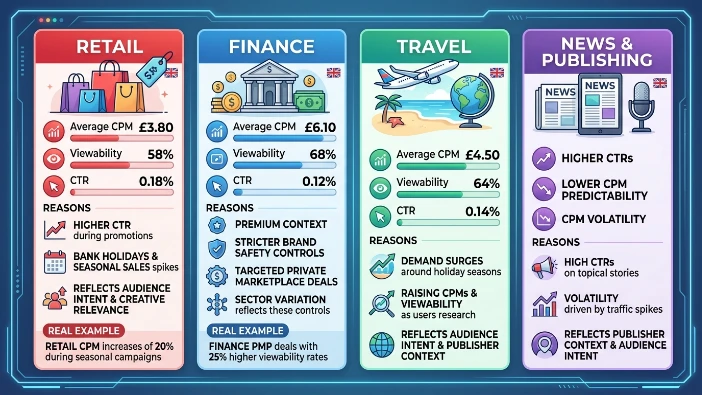
Sector variation reflects audience intent, creative relevance, and publisher context. Retail experiences higher CTRs during promotional periods such as bank holidays and seasonal sales. Finance secures higher CPMs due to premium context, stricter brand safety controls, and targeted private marketplace deals. Travel demand surges around holiday seasons, raising CPMs and viewability as users research options. News and publishing inventory yields high CTRs on topical stories but shows CPM volatility driven by traffic spikes. Real examples include retail CPM increases of 20% during seasonal campaigns and finance private marketplace deals with 25% higher viewability rates.
What is the relationship between viewability and CPM?
Higher viewability correlates with higher CPMs because buyers pay for guaranteed exposure quality. Inventory with viewability above 70% commands premiums of 20% to 60% versus below-50% placements.
Viewability serves as a quality filter for buyers allocating budgets to display. Publishers with strong viewability profiles sell inventory at premium rates through direct deals and private marketplaces. Advertisers balance reach needs against higher CPMs for quality placements. Measurement vendors and third-party verification services report viewability and provide invalid traffic filters, which affect net supply and pricing. Real examples include premium news homepage placements with 75% viewability sold at 50% higher CPM than long-tail remnant inventory.
How do device and placement affect CTR and viewability?
Mobile in-feed and native placements show CTRs of 0.20 and viewability of 60%. Desktop leaderboard placements show CTRs of 0.08 and viewability of 68%. In-app placements exhibit viewability above 70% and varied CTRs.
Device and placement govern attention patterns and creative space. Mobile in-feed formats align with content consumption and yield higher CTRs. Desktop placements offer larger visible area and higher viewability but lower relative CTR due to scrolling behavior and multi-tab browsing. In-app placements benefit from contained environments and higher viewability metrics driven by session focus. Publishers that implement sticky or anchored units show viewability increases but attract CPM adjustments. Real examples include mobile in-feed campaigns generating 30% more clicks per impression than standard mobile banner placements.
How should advertisers interpret CTR in the context of awareness versus performance goals?
Use CTR as a performance indicator for direct-response campaigns and deemphasize it for awareness goals. For awareness, prioritize CPM, viewability, and lift metrics instead of CTR-driven optimization.
CTR measures immediate engagement but underrepresents upper-funnel impact such as brand recall and search uplift. Awareness campaigns should optimize for cost-effective reach and verified viewability. Performance campaigns use CTR to gauge creative effectiveness and landing-page relevance. Complement CTR with post-exposure lift tests and conversion tracking to attribute long-term campaign value. Real examples include awareness flights that register low CTR but produce measurable search lift and brand survey improvements.
What measurement methods provide reliable banner contribution insights?
Reliable methods include randomized holdout lift tests, viewability-verified impressions, third-party verification for invalid traffic, and multi-touch attribution models calibrated with cohort analysis and conversion windows.
Randomized holdout tests measure incremental impact by comparing exposed and control groups. Viewability-verified impressions ensure measured inventory meets exposure thresholds. Third-party verification reduces fraud and improves data quality. Multi-touch attribution distributes credit across channels while cohort analysis tracks conversion behavior over defined windows, e.g., 7, 14, and 30 days. Use a combination of methods to capture both short-term conversions and long-term brand effects. Real examples include a holdout experiment that showed a 12% uplift in branded search following banner exposure.
How do creative format and size influence benchmarks?
Rich media and HTML5 creatives increase CTR by 40% and viewability by 15% compared with static images. Large formats (e.g., 970×250) lift engagement and CPM by 30% relative to 300×250 MPUs.
Creative complexity drives attention. HTML5 supports animations and interactivity that extend dwell time and interaction rates. Larger sizes achieve greater on-screen share and increase viewability probabilities. Video-first creatives embedded in display units produce higher engagement and deliver additional metrics such as view-through rate for in-banner video. Creative production costs increase with complexity, requiring trade-offs between creative investment and expected performance uplift. Real examples include expandable units generating double the dwell time of static banners on the same publisher site.
Explore More Expert Insights:
How to Write Banner Ad Copy Under 10 Words That Converts in a UK News Context
Creative Testing for UK News Site Banners: A 4-Variable Framework That Reduces CPC
What operational practices improve benchmark performance?
Implement frequency caps, optimize dayparting, use creative rotation, employ private marketplace buys for premium context, and run incremental lift tests. These practices improve efficiency and preserve CPM budgets.
Frequency caps prevent overexposure and reduce CPM waste. Dayparting aligns delivery with peak user activity windows to improve viewability and engagement. Creative rotation prevents fatigue and maintains CTRs. Private marketplaces provide higher viewability contexts and predictable inventory. Incremental lift tests validate the effectiveness of these practices through measurable outcomes. Real examples include reducing frequency from 8 to 3 per user and observing a 22% increase in CTR and lower wasted impressions.
When should advertisers prioritize viewability over reach?
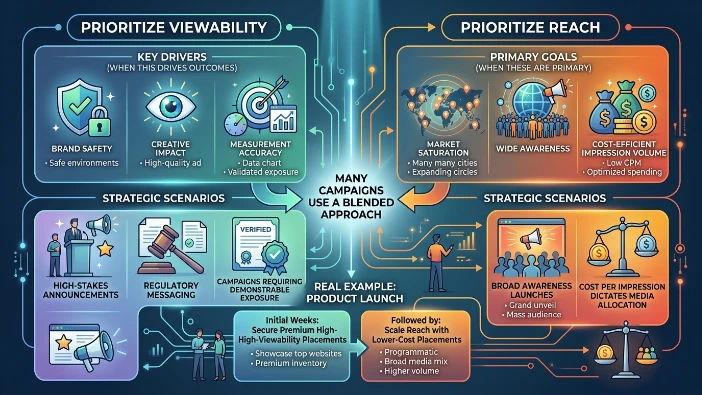
Prioritise viewability when brand safety, creative impact, or measurement accuracy drive outcomes. Prioritise reach when market saturation, wide awareness, or cost-efficient impression volume are primary goals.
Choose viewability focus for high-stakes announcements, regulatory messaging, or campaigns requiring demonstrable exposure. Choose reach focus for broad awareness launches where cost per impression dictates media allocation. Many campaigns use a blended approach: secure a baseline of viewable premium inventory and scale reach with lower-cost placements. Real examples include product launches using premium high-viewability placements for initial weeks followed by broad reach for scale.
Dive Deeper Into This Topic:
UK Digital Ad Spend Hit £20.4bn in 2025: Where Banner Advertising Fits in the Mix
UK display benchmarks in 2026 provide specific guidance for media planning CPM averages £4.20, viewability averages 62%, and CTR median is 0.15%. Sector, device, format, and buying method create wide variance. Advertisers should align metrics to campaign objectives, use rigorous measurement such as holdout lift tests, and optimise operations through frequency control, dayparting, and format selection. These practices increase the probability that display investment produces measurable business outcomes.
Explore the Advanced Guide:
Multi-Site Banner Campaign Setup: What to Expect in Week 1 Through Week 8



