
What Is Recency, Frequency, and Volume Scoring for Digital Publishers?
Recency, Frequency, and Volume scoring quantifies audience engagement by measuring how recently a user visited, how often they return within a defined window, and the total content volume they consume. This framework calculates precise numerical loyalty scores.
The Core Metrics of the Scoring Model
Digital media organizations evaluate reader engagement using three core measurements:
- Recency (R): The elapsed time, measured in days or hours, since a reader’s last session on the website or mobile application.
- Frequency (F): The total number of distinct user sessions completed within a specific timeframe, such as 30 days.
- Volume (V): The total number of article pages, videos, or audio units consumed across all sessions in that same timeframe.
Publishers collect these raw data points through standard web analytics tags, customer data platforms (CDPs), and user account databases.
Loyalty Score = (Recency Weight × R) + (Frequency Weight × F) + (Volume Weight × V)
By assigning specific numerical weights to each variable, media teams calculate a single composite engagement score for every recorded user profile.
Distinguishing RFV Data From General Web Analytics
Traditional web traffic measurements focus on overall site performance. Metrics such as monthly active users (MAU), total page views, and bounce rates track site-wide volume. However, these figures fail to show individual habit formation.
RFV scoring tracks behavior at the individual profile level using first-party cookies, unified reader identifiers, or logged-in account data. Rather than measuring total page views across the entire site, RFV scoring measures how many pages an individual reader reads each week. This distinction enables publishers to separate passive search traffic from habitual readers.
To understand the core principles of audience engagement models, publishers can review the fundamentals of recency, frequency and volume scoring.
How Do You Collect and Prepare Data for Reader Loyalty Scoring?
Publishers collect reader data using first-party analytics scripts, unify records via customer data platforms, and normalize the raw values on a 1-to-5 or 1-to-10 scale to establish standard scoring benchmarks across all audience segments.
Collecting First-Party Reader Data
Data collection relies on robust tracking across all digital properties. Web analytics scripts track session timestamps, user IDs, and page views. Mobile applications send event data through software development kits (SDKs). Email newsletter systems record click events and reader identifiers.
Publishers consolidate these data streams into a unified customer data platform or a central data warehouse. This consolidation ensures that a reader accessing content via a mobile app in the morning and a desktop web browser in the evening accumulates score points under a single profile.
Cleaning and Normalizing Raw Metrics
Raw metrics use different units of measurement. Recency measures time intervals, frequency measures session counts, and volume measures total page views. Direct addition of these raw figures creates skewed results because a user with 50 page views will dwarf a frequency count of 4 visits.
Media data teams convert raw data into normalized percentile ranks, typically using a 1-to-5 scale:
| Score | Recency Interval | Monthly Frequency | Monthly Page Views |
|---|---|---|---|
| 5 | Less than 24 hours | 15 or more visits | 30 or more pages |
| 4 | 1 to 3 days | 8 to 14 visits | 15 to 29 pages |
| 3 | 4 to 7 days | 4 to 7 visits | 7 to 14 pages |
| 2 | 8 to 14 days | 2 to 3 visits | 3 to 6 pages |
| 1 | More than 14 days | 1 visit | 1 to 2 pages |
Data processing algorithms run these normalization rules daily. Regular data updates ensure that reader scores reflect active reading habits rather than historical actions.
How Do You Calculate Recency, Frequency, and Volume Scores?
Calculating loyalty scores involves multiplying normalized Recency, Frequency, and Volume values by custom strategic weights, then adding the three totals together to create a unified numerical index between 1 and 100.
Setting Strategic Metric Weights
Publishers assign custom mathematical weights to Recency, Frequency, and Volume based on their specific business models. Weight distribution depends on whether the publisher prioritizes subscription sales, advertising revenue, or newsletter growth.
A subscription-focused publisher prioritizes Frequency and Recency, as habitual return visits indicate a high propensity to subscribe. An ad-supported publisher prioritizes Volume, as total page impressions generate ad inventory revenue.
Subscription Focus Model:
Loyalty Score = (Recency × 0.40) + (Frequency × 0.40) + (Volume × 0.20)

Ad-Supported Focus Model:
Loyalty Score = (Recency × 0.20) + (Frequency × 0.30) + (Volume × 0.50)
Step-by-Step Calculation Process
The scoring calculation follows a structured sequence for every reader profile in the database:
- Extract raw data for Recency, Frequency, and Volume over a rolling 30-day window.
- Map raw measurements to normalized 1-to-5 scale values.
- Apply the strategic weighting multipliers to each normalized value.
- Sum the weighted values to calculate the final composite score.
- Multiply the total by 20 to scale the final loyalty index from 1 to 100.
For example, consider a reader with the following raw data over 30 days:
- Last visit: 2 days ago (Recency score = 4)
- Total sessions: 10 visits (Frequency score = 4)
- Total pages read: 8 pages (Volume score = 3)
Using the Subscription Focus Model weighting:
- Weighted Recency: 4 × 0.40 = 1.60
- Weighted Frequency: 4 × 0.40 = 1.60
- Weighted Volume: 3 × 0.20 = 0.60
- Composite Raw Score: 1.60 + 1.60 + 0.60 = 3.80
- Scaled Loyalty Index: 3.80 × 20 = 76 out of 100
This reader registers a score of 76, placing them in the high-engagement tier.
How Do You Build Audience Segments From RFV Score Results?
Publishers build audience segments by grouping readers into defined score ranges, categorizing users into distinct tiers such as Brand Champions, Habitual Readers, Casual Visitors, and At-Risk Passives.
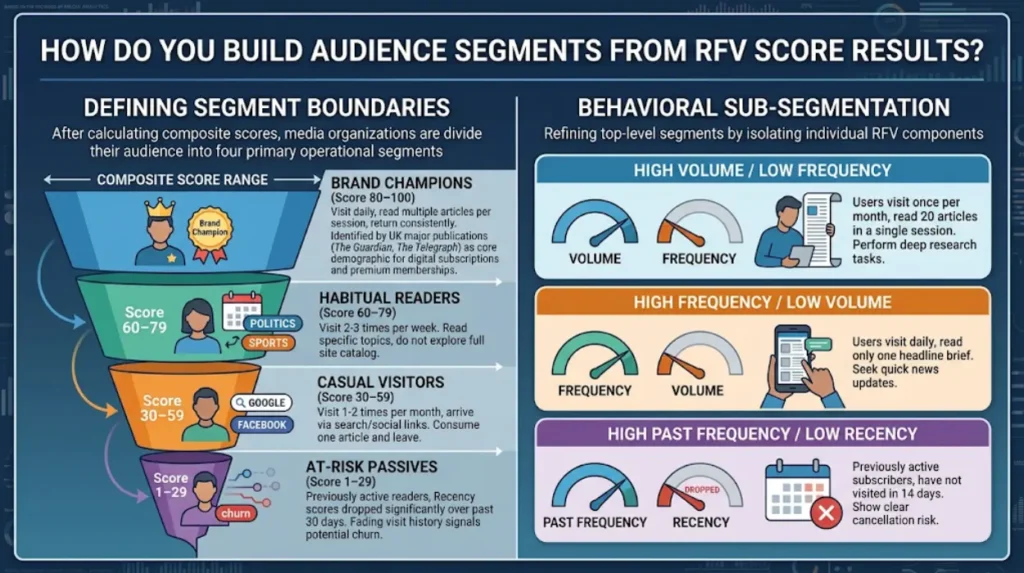
Defining Segment Boundaries
After calculating composite scores for all user profiles, media organizations divide their audience into four primary operational segments. These segments group readers with similar behaviors and commercial value.
Composite Score Range 80 to 100  -->  Brand Champions
Composite Score Range 60 to 79   -->  Habitual Readers
Composite Score Range 30 to 59   -->  Casual Visitors
Composite Score Range 1 to 29    -->  At-Risk Passives
Brand Champions (Score 80–100)
Brand Champions visit daily, read multiple articles per session, and return consistently. In the UK news market, major publications like The Guardian and The Telegraph identify this top tier as the core demographic for digital subscriptions and premium memberships.
Habitual Readers (Score 60–79)
Habitual Readers visit two to three times per week. They read specific topics, such as political analysis or sports coverage, but do not explore the full site catalog.
Casual Visitors (Score 30–59)
Casual Visitors land on the site once or twice per month, typically arriving via search engines or social media links. They consume one article and leave without exploring further.
At-Risk Passives (Score 1–29)
At-Risk Passives were previously active readers whose Recency scores have dropped significantly over the past 30 days. Their fading visit history signals potential churn.
Behavioral Sub-Segmentation
Publishers refine top-level segments by isolating individual RFV components. Isolating specific metric combinations reveals unique user habits:
- High Volume / Low Frequency: Users who visit once per month but read 20 articles in that single session. These users perform deep research tasks.
- High Frequency / Low Volume: Users who visit daily but read only one headline brief. These users seek quick news updates.
- High Past Frequency / Low Recency: Previously active subscribers who have not visited in 14 days. These users show clear cancellation risk.
What Are the Key Applications of RFV Segments for Media Publishers?
Publishers apply RFV segments to optimize dynamic paywalls, personalize newsletter distribution, target advertising campaigns, and automate reader retention workflows.
Dynamic Paywall Optimization
Standard metered paywalls offer every reader the same number of free articles before requiring payment. Dynamic paywalls use RFV audience segments to adjust access rules based on individual loyalty scores.
| Audience Segment | Paywall Access Rule | Primary Call to Action |
|---|---|---|
| Brand Champions | Strict Paywall | Paid Digital Subscription |
| Habitual Readers | Soft Meter (3 free) | Free Account Registration |
| Casual Visitors | Open Access | Newsletter Signup |
| At-Risk Passives | Open Access | Recommended Trending Content |
Brand Champions demonstrate high willingness to pay. Showing a subscription prompt to this tier maximizes conversion rates without driving away casual traffic. Conversely, Casual Visitors receive open access to build habit formation before encountering a paywall.
Publishers seeking advanced analytics solutions to automate segment-driven revenue models can deploy specialized reader loyalty scoring systems.
Content Personalization and Email Targeting
RFV segments direct newsletter delivery schedules and home page content layouts. Habitual Readers receive morning news briefs tailored to their primary interest areas, such as UK financial markets or retail sector news.
Automated marketing workflows trigger specific retention campaigns when a user’s score declines:
- Trigger Condition: A Brand Champion’s Recency score drops from 5 to 2.
- Automated Response: The system sends a re-engagement email featuring top-performing investigative stories from the user’s favorite topics.
Yield Optimization for Direct Advertising
Ad-supported media companies use RFV segments to sell high-value target audiences to advertisers. Premium brands pay higher cost-per-mille (CPM) ad rates to reach verified Brand Champions.
Advertisers targeting high-intent UK consumers prefer inventory viewed by habitual readers over random search traffic. RFV segmentation allows ad operations teams to guarantee ad viewability and audience engagement levels to agency partners.
Explore More Expert Insights:
How to Present Logistics Performance Data as a Research Report That Supply Chain Trade Media Will Publish
How to Track Share of Search and Share of Voice Against Competitors Using News Audience Data
How Does Scoring Reader Loyalty Drive Business Growth?
Scoring reader loyalty drives business growth by increasing paid conversion rates, reducing subscriber churn, raising advertising yields, and focusing content production on high-performing topics.
Conversion Rate and Subscription Revenue Growth
Targeting high-scoring readers increases conversion efficiency. Standard digital publishers convert roughly 0.5% to 1% of total unique visitors into paying subscribers. By presenting subscription offers exclusively to readers in the Brand Champions segment (scores 80–100), publishers achieve conversion rates between 5% and 10%.
This targeted approach protects advertising revenue from casual visitors while maximizing subscription intake from core readers.
Churn Reduction and Retention Optimization
Subscription growth depends heavily on minimizing customer churn. Decreasing Recency scores serve as an early warning indicator for subscriber cancellations.
Publishers monitoring daily RFV score changes detect engagement drops 14 to 30 days before a reader cancels a paid plan. Early detection enables automated re-engagement workflows that retain subscribers, preserving recurring revenue streams.
Strategic Content Planning
RFV data guides editorial investments. Editorial teams analyze which content categories attract habitual, high-scoring readers versus which topics draw one-time search traffic.
95% Casual Visitors
Low Commercial Value
80% Brand Champions
High Commercial Value
Newsrooms reallocate reporting resources toward habit-driven coverage. This strategic shift ensures editorial effort supports long-term reader loyalty and digital subscription revenue.
FAQs
Q1: How does Recency, Frequency and Volume data measure reader loyalty?
Ans: Recency measures how recently a reader visited, Frequency tracks how often they return, and Volume measures the amount of content or engagement consumed. Together, these metrics create a reader loyalty score based on actual audience behaviour.
Q2: How can publishers use Recency, Frequency and Volume data to segment readers?
Ans: Publishers can group readers according to high, medium, or low recency, frequency, and volume scores. This creates actionable audience segments such as loyal readers, frequent visitors, occasional readers, and inactive audiences.
Q3: What is a loyal reader segment based on Recency, Frequency and Volume scoring?
Ans: A loyal reader segment typically contains users who visit recently, return frequently, and consume a high volume of content. RFM-style or RFV scoring helps identify these high-value audience behaviours using measurable engagement data.
Q4: Why is reader segmentation important for digital publishers?
Ans: Reader segmentation helps publishers distinguish different engagement patterns across their audience. Segments based on recency, frequency, and content volume support more relevant editorial, engagement, and audience development strategies.
Q5: How can Times Intelligence Media Group use reader loyalty data to identify high-value audiences?
Ans: Times Intelligence Media Group can analyse recency, visit frequency, and content consumption volume to identify readers with consistently strong engagement. These behavioural signals provide a structured basis for defining high-value and at-risk reader segments.