
What Is Recency, Frequency and Volume Scoring?
Recency, frequency, and volume scoring evaluates audience engagement by measuring when a user last visited, how often they return, and how much content they consume over a specific timeframe, generating a unified numerical score that quantifies overall reader loyalty.
Recency, frequency, and volume scoring—commonly abbreviated as RFV—is a quantitative audience analytics framework used by modern digital publishers, subscription platforms, and media organizations. The system converts raw audience tracking data into actionable metrics by assigning distinct points to three independent behavioral dimensions.
last visit
tracking
window
read per
window
The model evaluates reader behavior across a fixed rolling time window, typically 30 days. By tracking these three dimensions, publishers convert abstract engagement metrics into concrete reader segments.
- Recency (R): Measures the number of days elapsed since a reader’s last interaction with the digital publication.
- Frequency (F): Measures the total number of distinct user sessions recorded within the active tracking period.
- Volume (V): Measures the total number of content items, individual articles, or pages consumed during those sessions.
Statistical models weigh each component to produce a composite RFV index score ranging from 0 to 100. Lower scores represent anonymous or pass-through search traffic, while higher scores identify highly committed core readers.
How Does Recency, Frequency and Volume Scoring Work?
Recency, frequency, and volume scoring works by tracking individual user interactions via browser cookies or reader accounts, calculating values for each behavioral pillar, applying weighting parameters, and aggregating the results into a single index score.
The scoring process relies on persistent user identification across digital properties. Audience measurement systems capture raw telemetry data whenever a reader interacts with an article, page, or multimedia asset.
Step 1: Data Collection and Tracking
Digital analytics tools collect event-level data whenever a user loads a webpage. The system records three primary data points: the exact timestamp of the visit, the unique user identifier, and the specific content resource accessed. Identification relies on first-party cookies, local browser storage, or logged-in user credentials.
Step 2: Pillar Calculation
The analytics platform calculates raw metrics for the active tracking window, such as the standard 30-day period.
- Recency equals the number of days between the current date and the recorded timestamp of the most recent user session.
- Frequency equals the total count of distinct active sessions initiated within the 30-day window.
- Volume equals the cumulative sum of articles read across all sessions within that same window.
Step 3: Weighting and Normalization
Raw metrics are converted into normalized scales, usually from 1 to 5 or 1 to 10, using pre-defined statistical bands. Publishers assign custom weighting factors to each pillar based on organizational priorities. A publication prioritizing habit formation assigns greater mathematical weight to frequency, whereas an archive-heavy publication prioritizes volume.
• Session count
• Page views
• Freq. (1-5)
• Volume (1-5)
• Freq. x W2
• Volume x W3
Step 4: Composite Score Generation
The system multiplies each normalized score by its assigned weighting factor and sums the values. The resulting single figure allows immediate comparison across the entire audience base, separating high-intent readers from transient visitors coming from external referral links.
What Are the Core Components of RFV Scoring?
The core components of RFV scoring are Recency, which gauges habit freshness; Frequency, which measures visiting habits over time; and Volume, which quantifies total depth of content consumption across the site.
Understanding the operational boundaries of each component ensures accurate data interpretation and cohort construction. Each metric isolates a unique psychological aspect of audience behavior.
drops as days
increase
increases with
repeat sessions
increases with
total articles
Recency
Recency measures time decay. A reader who visited 2 hours ago has a high recency score, whereas a reader whose last session occurred 25 days ago receives a low recency score. Recency serves as the primary indicator of active audience retention. A drop in recency indicates imminent churn or fading brand awareness.
Frequency
Frequency measures return habits. A user who visits once a day for 5 consecutive days generates a higher frequency score than a user who visits once every 2 weeks. Frequency differentiates dedicated brand advocates from passive search engine users who land on a single page via organic search results.
Volume
Volume measures session depth and breadth. A reader who consumes 8 articles during a single visit generates a higher volume score than a reader who leaves after scanning a single headline. Volume indicates topic affinity, editorial resonance, and overall content engagement.
How Does RFV Scoring Identify Loyal Readers?
RFV scoring identifies loyal readers by setting empirical thresholds across all three metrics, isolating visitors who demonstrate consistent return patterns, high content consumption, and recent site interactions from casual referral traffic.
Audience segmentation models divide web traffic into distinct behavioral cohorts. Anonymous referral traffic typically displays low recency, low frequency, and low volume. Highly engaged readers demonstrate top-tier metrics across all three categories.
Distinguishing Intent and Loyalty
Traditional analytics rely on pageviews or unique visitors. These top-level metrics treat a surface-level search visitor identically to a daily newsletter subscriber. RFV scoring eliminates this blind spot by synthesizing time, cadence, and depth.
- Casual Readers: High recency, low frequency, low volume. These users visit once via a news aggregator link or social media feed and read a single article.
- Topic-Specific Researchers: High volume, low frequency, low recency. These users read 10 articles in one day while researching a specific subject, but do not return.
- Loyal Core Readers: High recency, high frequency, high volume. These users visit multiple times per week, consume multiple articles per session, and maintain this behavior consistently.
By identifying users who consistently maintain scores in the upper target percentiles, media organizations isolate their most valuable audience segment. This segment represents the core reader group most likely to register, subscribe, or support the publication.
Explore More Expert Insights:
Why Are Supply Chain and Logistics Research Reports Valuable to UK Procurement Teams?
What Are Share of Search and Share of Voice, and How Do They Signal Brand Momentum?
What Are the Benefits of Using RFV Scoring for Media Organizations?
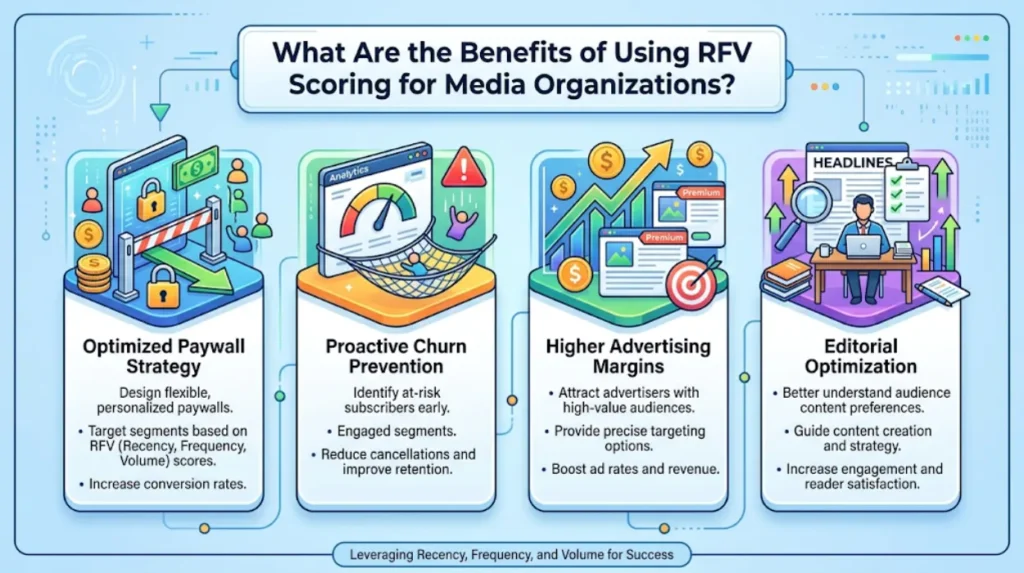
The primary benefits of RFV scoring include precise audience segmentation, reduced subscriber churn, optimized dynamic paywall targeting, increased advertising efficiency, and clear editorial insights into content performance.
Media organizations operate in highly competitive digital distribution environments. Implementing quantitative scoring models improves operational efficiency across subscription management, editorial strategy, and ad monetization.
Optimized Paywall Strategy
Dynamic paywalls adjust access restrictions based on user behavior. RFV scoring provides the precise numerical triggers required for dynamic metering. High-RFV readers encounter subscription prompts because their behavioral score demonstrates strong willingness to pay. Low-RFV visitors receive unrestricted access to encourage habit formation and initial content exposure. Readers seeking implementation methods can read about how to perform reader loyalty scoring to convert behavioral data into structured audience segments.
Proactive Churn Prevention
Subscriber retention depends on early detection of declining usage patterns. A drop in recency score signals reduced engagement weeks before a subscriber explicitly cancels a paid plan. Automated systems flag declining recency scores, triggering retention workflows such as personalized email digests or re-engagement newsletters.
Higher Advertising Margins
Direct-sold display advertising relies on verified audience engagement. Publishers package high-RFV reader cohorts into premium advertising segments. Advertisers pay higher cost-per-mille rates for access to loyal, highly engaged reader groups who spend more time on site and interact with brand messaging.
Editorial Optimization
Content strategies benefit from granular engagement data. RFV scoring reveals which content categories drive return visits versus single-page search bounces. Editorial teams analyze high-RFV reader preferences to allocate journalistic resources toward topics that build long-term reader habits.
How Can Digital Publishers Apply RFV Scoring in Practice?
Digital publishers apply RFV scoring by integrating analytics platforms with content management systems, setting custom metric weights, defining operational cohorts, and automating targeted marketing or paywall actions based on live scores.
Deploying RFV models requires clear strategic planning and technical alignment across marketing, data, and editorial departments.
First-party IDs
Frequency vs Volume
for user buckets
Targeted Email Lists
Establishing Weighting Parameters
Publishers establish mathematical weights reflecting their business models. A digital subscription service prioritizes recency and frequency to encourage daily reading habits. An ad-supported trade journal prioritizes total volume to maximize display ad impressions.
- Subscription Model Weighting: Recency 40%, Frequency 40%, Volume 20%.
- Ad-Supported Model Weighting: Recency 20%, Frequency 30%, Volume 50%.
Defining Audience Segments
Publishers divide their total audience database into clear behavioral tiers based on composite RFV scores:
- Brand Champions (Score 80–100): Daily visitors consuming multiple articles per week. Target for direct subscriptions, premium memberships, and exclusive events.
- Habitual Readers (Score 50–79): Regular visitors returning 2 to 3 times per week. Target with newsletter registration drives and soft paywall metering.
- Casual Readers (Score 20–49): Monthly visitors arriving via search or social referrals. Target with recommended content modules to build visit volume.
- Passers-by (Score 0–19): One-time visitors with low engagement. Expose to standard site navigation and ad units without intrusive gating.
Integrating Automated Workflows
Marketing automation platforms pull live RFV scores from customer data platforms. When a casual reader moves into the habitual segment, the system updates their profile and triggers onboarding campaigns. When a subscriber’s recency score falls below threshold values, the platform automatically queues re-engagement communications to rebuild reading habits.
What Is the Difference Between RFM and RFV Scoring?
The difference is that traditional RFM scoring measures Monetary value for direct transactional commerce, whereas RFV scoring replaces monetary value with Volume to measure non-transactional content consumption in digital publishing.
RFM (Recency, Frequency, Monetary) originated in direct-mail retail and e-commerce. It tracks purchase dates, transaction frequencies, and total monetary spend. This framework evaluates explicit revenue-generating events like store orders or catalog purchases.
Digital media platforms often lack immediate purchase transactions for every user session. Readers consume content supported by advertising, sponsorships, or metered paywalls before spending money. RFV substitutes Volume for Monetary value, turning content pageviews into a proxy for attention capital.
Volume measures attention investment. A reader who consumes 30 articles in a month demonstrates significant brand affinity, even if they have not yet completed a monetary subscription. RFV allows publishers to quantify and nurture audience engagement long before a direct financial transaction occurs.
Recency, frequency, and volume scoring provides digital media organizations with an empirical framework for measuring reader loyalty. By tracking when users visit, how often they return, and how much content they consume, publishers convert raw web analytics into actionable audience insights. Implementing RFV models enables precise audience segmentation, optimized subscription strategies, improved churn management, and data-driven editorial planning.
FAQs
Q1: What is Recency Frequency and Volume scoring for readers?
Ans: Recency, Frequency and Volume scoring measures how recently, how often and how deeply readers engage with content. It helps publishers identify audience engagement patterns and distinguish loyal readers from occasional visitors.
Q2: How does Recency Frequency and Volume scoring identify loyal readers?
Ans: Loyal readers typically return frequently, engage with content consistently and consume a higher volume of articles. A combined scoring model uses these behaviours to identify readers with strong and sustained engagement.
Q3: Why is reader loyalty scoring important for publishers?
Ans: Reader loyalty scoring helps publishers understand which audience segments generate consistent engagement. It supports decisions about content strategy, audience retention, subscriptions and reader experience.
Q4: What factors are used in reader engagement scoring?
Ans: The main factors are recency, frequency and volume of content consumption. These measures show when readers last engaged, how regularly they return and how much content they consume over a defined period.
Q5: How can Times Intelligence Media Group use reader loyalty data?
Ans: Times Intelligence Media Group can use reader loyalty data to analyse engagement patterns and segment audiences by reading behaviour. These insights can inform editorial planning, audience development and data-driven content decisions.