
What are share of search and share of voice in competitive brand measurement?
Share of search measures a brand’s proportion of relevant search interest, while share of voice measures its proportion of media visibility. Comparing both metrics against competitors shows how strongly a brand appears in search and news coverage.
Share of search is a search visibility metric. It compares the volume of searches associated with one brand against the combined search volume for a defined competitive set. For example, if a category receives 100,000 brand-related searches and one company accounts for 25,000, that company has a 25% share of search.
Share of voice is a visibility metric. It measures the proportion of relevant media coverage, mentions, or communications activity attributed to a brand within a defined market or topic.
News audience data adds another measurement layer. It shows where coverage reaches audiences, which publications generate exposure, and how competitor visibility differs across relevant news environments.
The two metrics answer different questions. Share of search identifies demand and active interest. Share of voice identifies media presence. News audience data connects media exposure with the audiences receiving that exposure.
Brands therefore gain a clearer competitive measurement framework when search behaviour, news visibility, publication reach, and competitor activity are assessed together.
For a broader introduction to the relationship between these metrics and brand momentum, see share of search and share of voice.
How does news audience data improve competitor share of voice tracking?
News audience data improves share of voice tracking by measuring media visibility alongside the size and relevance of audiences reached. It identifies competitor coverage, publication distribution, audience exposure, topics, and changes in visibility across defined periods.
Basic share of voice measurement often counts brand mentions. News audience data adds audience context to those mentions.
A national newspaper article and a specialist trade publication represent different media environments. Their audience composition, reach, geographic relevance, and subject relevance differ. Counting both mentions equally can therefore produce an incomplete competitive picture.
News audience data can classify coverage by:
- Publication
- Geographic market
- Audience reach
- Sector relevance
- Topic
- Publication type
- Coverage date
- Brand mention
- Competitor mention
- Content volume
For example, a UK technology company can compare its mentions across national newspapers, technology publications, business media, and regional news outlets. Competitor coverage can be assessed using the same publication groups.
This creates a more consistent share of voice calculation. The measurement remains based on defined coverage criteria rather than isolated high-profile articles.
Audience data also helps distinguish visibility from distribution. A brand with 100 mentions across low-reach publications has a different media position from a competitor with 40 mentions across high-reach publications.
How do you calculate share of search against competitors?
Calculate share of search by dividing one brand’s relevant search volume by the combined relevant search volume of all defined competitors, then multiplying by 100. Use the same market, period, search terms, and competitor set for every brand.
The basic formula is:
Brand Share of Search = Brand Search Volume ÷ Total Competitive Search Volume × 100
Assume four UK brands receive the following monthly search volumes:
- Brand A: 30,000 searches
- Brand B: 25,000 searches
- Brand C: 20,000 searches
- Brand D: 25,000 searches
The total competitive search volume is 100,000. Brand A therefore has a 30% share of search.
The calculation becomes useful when repeated consistently. Monthly or quarterly measurement creates a historical benchmark.
Search terms also require clear definition. Brand names, branded product searches, category terms, and competitor terms produce different measurements. A study focused on brand demand needs consistent keyword rules.
Search geography also matters. A UK-focused analysis needs UK search data. Combining UK, US, and European search behaviour produces a different competitive measurement.
The competitor set must remain stable during each reporting period unless a defined market change requires an update. Adding or removing competitors without documenting the change affects comparability.
How do you calculate share of voice using news audience data?
Calculate news share of voice by dividing a brand’s qualifying news coverage by total qualifying competitor coverage, then applying consistent audience, publication, topic, geography, and time-period rules to every brand in the comparison.
A basic coverage-based formula is:
Brand Share of Voice = Brand Qualifying Mentions ÷ Total Competitive Mentions × 100
Audience-weighted analysis applies additional relevance to the media exposure. Instead of treating every article equally, the analysis can assess the audience associated with each publication.
For example, consider 200 qualifying articles across four competitors. Brand A appears in 60 articles, giving it a 30% coverage share.
A separate audience analysis then examines where those 60 articles appeared. If most coverage appeared in publications with substantial UK business audiences, the exposure has a different strategic significance from coverage concentrated in small specialist outlets.
The calculation therefore benefits from separate reporting for coverage volume and audience exposure. This prevents a single metric from hiding important differences.
Useful measurements include:
- Total coverage volume
- Percentage of competitor coverage
- Estimated audience reach
- Publication reach
- National versus regional exposure
- Sector publication exposure
- Topic-level coverage
- Brand and competitor frequency
What news audience data should you collect for competitor analysis?
Collect publication, audience, geography, topic, date, brand, competitor, and coverage-type data. Consistent fields create comparable datasets for measuring media visibility, audience exposure, competitive share of voice, and changes over time.
A structured dataset needs defined fields before measurement begins.
Publication data
Record the publication name, publication category, geographic focus, and relevant sector. UK national newspapers, regional publications, trade media, and specialist websites can be separated into distinct groups.
Audience data
Record available audience or reach information for each publication. Keep the measurement methodology consistent across competitors.
Coverage data
Record the publication date, article URL, brand mention, competitor mention, topic, and coverage type.
Geographic data
Separate UK-wide coverage from regional coverage where location affects campaign objectives. London-focused coverage, for example, represents a different geographic footprint from coverage across Scotland, Wales, Northern Ireland, or English regions.
Topic data
Classify coverage by product, service, corporate announcement, executive commentary, industry development, research, or another defined topic.
This structure enables analysis beyond simple mention counting.
How can you compare share of search with share of voice?
Compare share of search and share of voice by measuring both metrics over the same period and competitor set. The difference between them identifies gaps between search interest and media visibility across brands and market categories.
Suppose Brand A has:
- 30% share of search
- 20% share of voice
Brand B has:
- 20% share of search
- 35% share of voice
The results show different competitive positions.
Brand A has stronger search demand relative to its news visibility. Brand B has stronger media visibility relative to its search share.
This comparison does not establish a direct causal relationship. Search interest and media coverage respond to different factors, including consumer behaviour, brand activity, market events, campaigns, product launches, and competitor activity.
The value comes from observing patterns over time.
A monthly dataset can show whether increasing media visibility accompanies increasing search interest. A quarterly dataset can identify broader changes in competitive positioning.
The analysis becomes more useful when the same measurement framework is applied consistently.
Explore More Expert Insights:
How to Structure an Electric Vehicle Market Report That UK Motoring and Business Media Will Cite
How to Turn Energy Market Data Into a Research Report That UK Business and Trade Media Will Cover
Which components matter when benchmarking competitors?
Effective competitive benchmarking combines search demand, media coverage, audience reach, publication quality, topic relevance, geography, and time. These components create a consistent measurement framework for comparing brand visibility across the UK market.
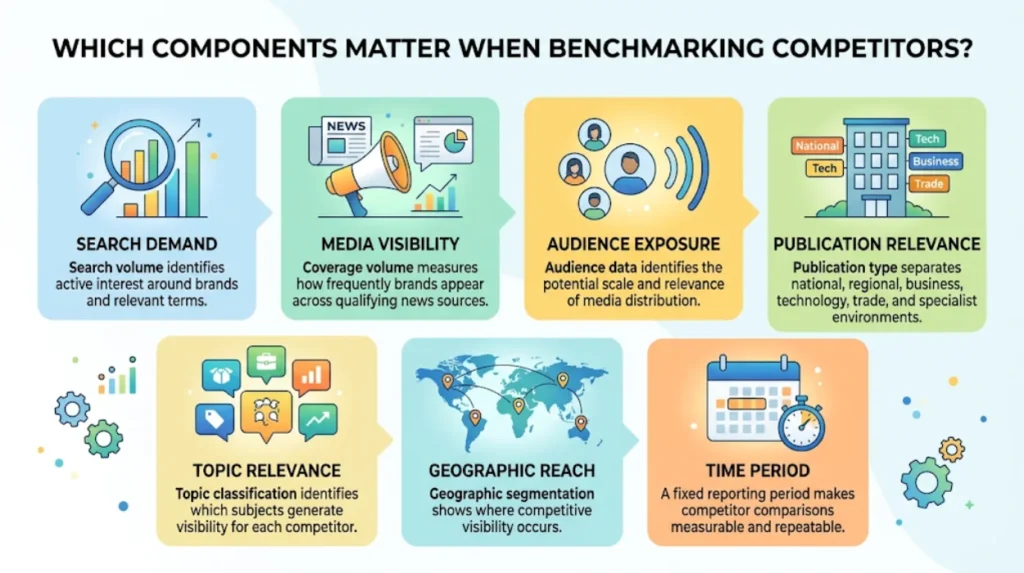
Search demand
Search volume identifies active interest around brands and relevant terms.
Media visibility
Coverage volume measures how frequently brands appear across qualifying news sources.
Audience exposure
Audience data identifies the potential scale and relevance of media distribution.
Publication relevance
Publication type separates national, regional, business, technology, trade, and specialist environments.
Topic relevance
Topic classification identifies which subjects generate visibility for each competitor.
Geographic reach
Geographic segmentation shows where competitive visibility occurs.
Time period
A fixed reporting period makes competitor comparisons measurable and repeatable.
These components prevent share of search and share of voice from becoming isolated headline numbers. Each metric becomes part of a broader competitive visibility dataset.
What are the benefits of using news audience data for competitive benchmarking?
News audience data provides stronger competitive context by showing where brands receive coverage, which audiences those publications reach, and how media visibility compares with search demand across the same market and reporting period.
One benefit is improved competitor comparison. Brands can identify competitors receiving greater media exposure without assuming that higher article volume automatically represents stronger audience reach.
Another benefit is topic analysis. A competitor can dominate coverage around innovation while receiving limited visibility around corporate responsibility, leadership, or market expansion.
Geographic analysis also identifies coverage concentration. A brand with strong national exposure and a competitor with strong regional exposure occupy different media positions.
Historical tracking provides another advantage. Repeated measurements reveal changes in competitive visibility rather than relying on one reporting period.
News audience data also supports more precise media planning. Teams can identify publication categories and audience environments where competitors have stronger visibility.
The resulting analysis supports informed decisions without turning share of voice into a standalone performance indicator.
How can businesses use share of search and share of voice data?
Businesses use these metrics to monitor competitors, assess campaign visibility, identify media gaps, measure market presence, and evaluate changes in brand demand. News audience data adds publication and audience context to each competitive measurement.
Brand benchmarking
Marketing teams can compare their search and media position with three, five, or ten direct competitors.
Campaign measurement
Teams can measure whether campaign periods coincide with changes in media visibility and search interest.
Media planning
Audience data identifies publication groups where competitors receive significant exposure.
Reputation monitoring
Organisations can track the volume and topics of coverage associated with their brand and competitors.
Market analysis
Share of search trends identify changes in brand interest within a defined category.
Competitive reporting
Leadership teams can receive consistent monthly or quarterly measurements showing search demand, coverage volume, audience exposure, and competitor movement.
For example, a UK financial services company can compare branded search demand with coverage across financial publications, national business media, and regional news sources. A technology company can apply the same framework across technology, business, and specialist publications.
How should businesses build a repeatable competitor measurement process?
Build a repeatable process by defining competitors, keywords, publications, audience metrics, geography, topics, and reporting periods before collecting data. Apply the same definitions each cycle and record changes to maintain reliable competitive benchmarks.
Start with the competitive set. Identify the brands that represent the relevant market.
Next, define the search terms. Separate brand-specific searches from category searches where required.
Then establish the news dataset. Select relevant UK publications and define the audience measurements used for comparison.
Set the reporting period. Monthly measurement provides detailed movement, while quarterly measurement provides broader competitive context.
Apply consistent classification rules. A brand mention counts only when it meets the defined coverage criteria.
Finally, compare the results across reporting periods.
The reporting output can include share of search, share of voice, coverage volume, audience exposure, topic distribution, geographic distribution, and competitor changes.
This process creates a stable measurement framework that supports ongoing market analysis.
What should businesses consider before choosing audience insight solutions?
Businesses should assess data coverage, publication breadth, audience measurement methods, competitor tracking, geographic detail, topic classification, reporting frequency, and integration with search data before selecting an audience insight solution.
Data coverage is the first consideration. A useful dataset needs sufficient UK publication coverage for the market being analysed.
Measurement consistency is equally important. Competitor results need to use comparable publication and audience definitions.
The solution also needs to support historical analysis. Without consistent historical records, changes in share of voice cannot be assessed accurately.
Search benchmarking adds another layer. A combined approach lets teams compare media visibility with search demand rather than analysing either metric independently.
Businesses can evaluate these capabilities before selecting a specific service. The objective is to establish which data sources, metrics, and reporting structures match the competitive measurement requirement.
For organisations ready to assess a dedicated solution, share of search benchmarking provides a natural next step into audience-led competitive measurement.
Share of search and share of voice become more informative when measured against the same competitors, markets, topics, and periods. News audience data adds the publication and audience context required to understand where competitive visibility occurs.
A consistent framework therefore connects search demand, media coverage, audience exposure, and competitor movement into one measurable view of brand presence.
FAQs
Q1: How do you track share of search against competitors?
Ans: Track branded search volume for your business and key competitors over the same period, then compare each brand’s proportion of total category searches. News audience data can add context by showing whether changes in search interest align with shifts in media reach and audience exposure.
Q2: What is the difference between share of search and share of voice?
Ans: Share of search measures the proportion of category-related searches associated with a brand, while share of voice measures its visibility across media or communications channels. Comparing both metrics helps identify whether media visibility is translating into active consumer interest.
Q3: How can news audience data measure brand visibility against competitors?
Ans: News audience data measures the potential reach and audience exposure generated by coverage across relevant news publications. Comparing these figures with competitor coverage helps assess relative media visibility and changes in share of voice.
Q4: How can Times Intelligence Media Group use news audience data to track brand momentum?
Ans: Times Intelligence Media Group can combine news audience reach, media coverage and competitor visibility with share of search data to monitor changes in brand momentum. This creates a broader view of how media exposure relates to growing or declining audience interest.
Q5: Why compare share of search and share of voice over time?
Ans: Tracking both metrics over time reveals whether changes in media visibility correspond with changes in branded search demand. A rising share of voice followed by stronger share of search can indicate increasing brand awareness and competitive momentum.