

Event media coverage measurement is the systematic tracking and evaluation of published content about an event across media channels to assess reach, quality, and outcomes. It includes quantitative reach, qualitative tone, placement quality, audience relevance, message pickup, distribution speed, and earned value.
Measurement begins with a clear definition of coverage. Coverage equals any third-party or owned publication, broadcast, post, or recording that references the event. Channels include national and local press, broadcast, social platforms, podcasts, industry blogs, and wire services. Measurement requires an initial scope: list target outlets, priority audiences, and key messages.
Trackable artifacts include articles, transcripts, video clips, audio segments, social posts, and syndicated copies. A central repository stores collected items with timestamps and source URLs. Each collected item receives structured metadata: outlet name, publication time, format, audience estimate, and whether the item includes quotes or visual assets. Measurement converts raw coverage into metrics that reflect strategic goals.
How do you move from raw coverage to usable metrics?
Transform raw coverage into metrics by collecting content, tagging attributes, quantifying reach, and scoring quality against predefined criteria and weightings. Use automated monitoring plus human verification to ensure accuracy.
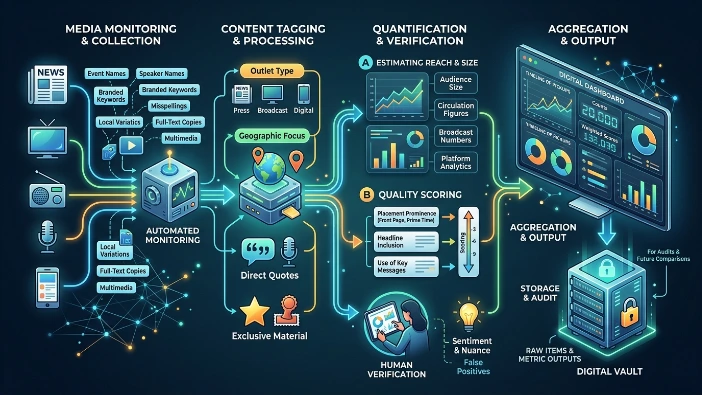
Start collection with media-monitoring tools configured with event names, speaker names, and branded keywords. Include likely misspellings and local variations. Capture full-text copies and multimedia where available. Tag each item for outlet type, geographic focus, and whether it contains direct quotes from spokespeople or exclusive material. Estimate audience size using outlet circulation figures, broadcast audience numbers, or platform analytics for native posts.
Apply quality scores based on placement prominence, headline inclusion, and use of key messages. Aggregate metrics into dashboards that show counts, weighted scores, and timeline of pickups. Validate automated captures through human review for false positives and to confirm sentiment where nuance matters. Store both raw items and metric outputs for audits and future comparisons.
Which seven metrics go beyond impressions?
Seven advanced metrics: Quality-Adjusted Reach, Message Penetration Rate, Placement Prominence, Share of Voice in Priority Media, Sentiment-Adjusted Reach, Time-to-Publish, and Earned Media Value. Each metric measures a different outcome dimension and uses clear formulas.
Quality-Adjusted Reach weights raw reach by outlet relevance and placement prominence. Use outlet relevance scores from 0 to 1 and multiply by audience estimates. Message Penetration Rate equals the percentage of coverage items that include one or more predefined key messages or quotes. Placement Prominence scores include whether the event appears in headlines, lead paragraphs, or as ancillary mentions; assign numeric values and average across items. Share of Voice in Priority Media compares event coverage volume to competitors or related events within a fixed set of priority outlets over a set timeframe. Sentiment-Adjusted Reach multiplies reach by a sentiment coefficient derived from manual review or AI classification: positive = 1, neutral = 0.5, negative = 0.2. Time-to-Publish measures median hours from event end to first publication across outlets. Earned Media Value (EMV) converts coverage into an estimated advertising equivalent using outlet rate cards or standard CPM values adjusted by placement prominence.
How do you define and calculate Quality-Adjusted Reach?
Quality-Adjusted Reach equals the sum of outlet audience estimates multiplied by outlet relevance and placement prominence for each coverage item. Use published circulation, BARB, or platform analytics as audience estimates.
First, assign relevance values: 1.0 for priority national outlets, 0.7 for national trade press, 0.5 for local press, and 0.3 for niche blogs. Next, assign placement prominence values: 1.0 for headline or top-slot broadcast, 0.6 for feature paragraph, and 0.3 for passing mention. For each item, calculate item reach = audience estimate × relevance × prominence. Sum item reach across all items to get Quality-Adjusted Reach. Example: a national outlet with 500,000 audience, relevance 1.0, prominence 1.0 contributes 500,000. A local outlet with 20,000 audience, relevance 0.5, prominence 0.3 contributes 3,000. Use this metric to prioritise outlets and evaluate trade-offs between high-volume but low-relevance pickups and low-volume high-relevance coverage.
How is Message Penetration Rate measured?
Message Penetration Rate equals the proportion of coverage items that explicitly include one or more predefined event messages or spokesperson quotes, expressed as a percentage. Use a binary presence check per item and report the percentage.
Before measurement, define 3 to 7 core messages or talking points with exact phrase variants for capture. Review each coverage item for message presence. Mark items that contain at least one message as positive. Calculate the rate as positive items divided by total items times 100. Example: 120 collected items with 54 items including messages yield a Message Penetration Rate of 45%. Report penetration by message to identify which messages perform best. Use this metric to refine spokesperson briefing, media materials, and embargo strategies.
What is Placement Prominence and how do you score it?
Placement Prominence is a numerical score reflecting where coverage appears and how prominent the placement is within the outlet; it ranges from 0.1 for minor mentions to 1.0 for top placement. Use a consistent rubric applied by reviewers.
Define the rubric: headline/top broadcast slot = 1.0; front-page article or lead broadcast segment = 0.9; feature within main news section = 0.7; secondary article or section page = 0.5; sidebar or brief mention = 0.3; caption-only mention = 0.1. Train reviewers with annotated examples from national and local UK outlets to ensure consistency. Record the prominence score per item and use it in Quality-Adjusted Reach and EMV calculations. Track changes in average prominence across events to assess improvements in media pitching and relationships.
How do you measure Time-to-Publish and why it matters?
Time-to-Publish is the median elapsed time in hours from event end to first coverage across tracked outlets; track median and 90th percentile for distribution understanding. Shorter times show stronger immediate pickup and newsworthiness.
Collect timestamps for event end and for each coverage item publication. Convert times to UTC and compute hours elapsed. Report median hours, 90th percentile hours, and the fastest and slowest pickup times. Example: median 6 hours, 90th percentile 28 hours indicates most coverage appears within the same day but some outlets publish later. Use Time-to-Publish to evaluate embargo strategy effectiveness and to optimise post-event asset distribution for faster pickup.
Explore More Expert Insights:
Speaker Amplification: How to Turn 8 Presenters Into 8 Separate UK Media Stories
How to Pitch an Event Story to a UK News Editor Without Getting Ignored
How is Earned Media Value calculated and used?
Earned Media Value converts coverage into a monetary equivalent using outlet advertising rates, CPM benchmarks, and placement adjustments to produce a comparable publicity value. Use measured reach, CPM rates, and placement multipliers for calculation.
Select a CPM baseline appropriate to the outlet type: national print CPM, online display CPM, or broadcast rate. Multiply Quality-Adjusted Reach by the CPM to estimate advertising equivalent. Apply placement multipliers for headline or prime-slot coverage. Clearly document the CPM source and multiplier logic for transparency. Use EMV for internal comparisons across events and for budget discussions. Report EMV alongside non-monetary indicators to avoid over-reliance on monetary proxies for reputational outcomes.
What operational changes improve these metrics?
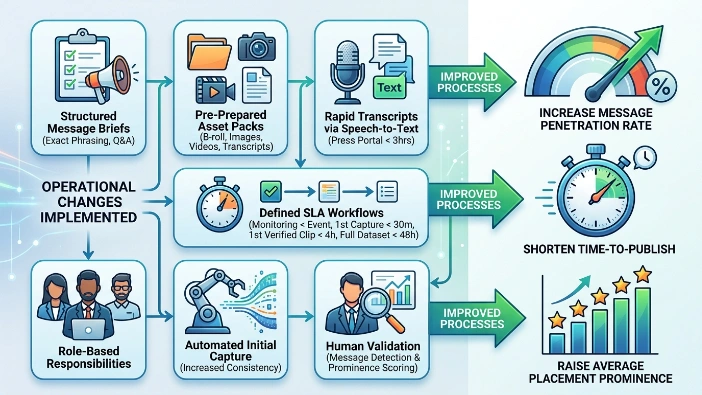
Operational changes include structured message briefs, pre-prepared asset packs, tiered outlet lists, rapid transcript delivery, and defined SLA workflows for collection and review. Implement role-based responsibilities and automated capture to increase consistency.
Prepare message briefs with exact phrasing and anticipated Q&A. Provide asset packs containing B-roll, key images with captions, short video clips, and transcript excerpts to reduce friction for journalists. Maintain tiered lists of outlets with contact details and preferred formats. Use speech-to-text for rapid transcripts and publish them to a press portal within 3 hours. Assign clear SLAs: monitoring begins at event start, the first capture is within 30 minutes, the verified first publishable clip is within 4 hours, and the full dataset is within 48 hours. Automate initial capture but keep human validation for message detection and prominence scoring. These changes increase message penetration rate, shorten time-to-publish, and raise average placement prominence.
Explore More Expert Insights:
From Room to Feed: How UK Event Content Travels Across 10 Platforms in 24 Hours
Advanced measurement moves beyond raw impressions to metrics that reflect relevance, message uptake, prominence, speed, and value. Use Quality-Adjusted Reach, Message Penetration Rate, Placement Prominence, Share of Voice in Priority Media, Sentiment-Adjusted Reach, Time-to-Publish, and Earned Media Value to capture different performance dimensions. Define clear formulas, use mixed automated and human processes, and report with documented assumptions for comparability.
Read the Detailed Explanation:
Event Coverage Proposal Checklist: 12 Deliverables to Demand From Any UK Partner



