

Video is recorded or live audiovisual content; a live blog is a real-time text update stream; a recap is a post-event written summary. Each format serves distinct audience behaviours and distribution channels.
Video delivers sight and sound in the same asset. A live blog delivers minute-by-minute text, short quotes, and embedded media. Recap delivers structured paragraphs, key takeaways, and analysis after the event ends. Platforms matter: social networks and video platforms host video; newsrooms and event microsites host live blogs; blogs and newsletters host recaps. Metrics differ: views and watch time for video, page visits and time-on-page for live blogs, and shares and backlinks for recaps.
Which format generates the most social shares in the UK?
Live video generates the highest share volume for time-sensitive content; recaps generate the highest long-term shares for referenceable insight; live blogs perform best during fast-paced breaking events.
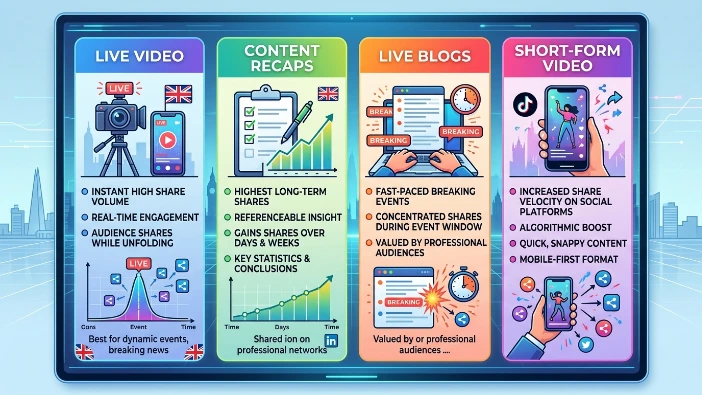
Live video attracts immediate engagement because audiences share while the event unfolds. Recaps gain shares over days and weeks as readers reference conclusions or statistics. Live blogs concentrate shares during the event window and among professional audiences who value real-time updates. Platform algorithms influence share rates: short-form video formats increase share velocity on social platforms, while long-form written recaps attract shares on professional networks and via email.
How do audience segments affect format performance?
Younger audiences favour short video clips; professionals favour live blogs and recaps with data; regional audiences favour short video plus concise recaps.
Demographics drive content choice. Audiences aged 18–34 interact more with short video highlights and clips. Professional audiences in sectors such as finance, law, and healthcare consume live blogs and recaps for factual detail and verbatim quotes. Regional communities engage with video that highlights local faces and outcomes, and with recaps that summarise local economic impact. Content distribution must match audience habits to increase shares.
What metrics determine “most shares” for each format?
Key metrics: total shares across platforms, share rate per view, referral traffic from shares, and social engagement velocity within 24 hours.
Total shares measure raw distribution. Share rate per view measures share propensity relative to reach. Referral traffic measures downstream site visits from shared posts. Engagement velocity tracks share accumulation in the first 24 hours. Video often shows high total shares and rapid velocity. Live blogs show higher share rates among niche audiences. Recaps produce sustained referral traffic and steady share accumulation over 7–30 days.
How does production complexity influence format choice?
Video requires cameras, editors, and hosting; live blogs require moderation, live reporting staff, and a publishing platform; recaps require post-event writing and fact-checking.
Video production needs hardware, editing software, and streaming capacity for live feeds. Live blogging needs at least one trained live reporter, a moderator for comments, and a stable content management setup. Recaps need an author, editor, and time for verification. Resource limits make recaps the lowest-cost option. Video production costs scale with length and quality. Live blogs require staff during the event time window.
What distribution tactics increase shares for each format?
For video, use short clips, platform-native uploads, and captioning; for live blogs, promote permalinked updates and highlight quotable lines; for recaps, emphasise data, clear headlines, and shareable pull-quotes.
Video performs when trimmed to 15–60 seconds for social feeds and when uploaded natively to each platform. Captions increase watch rates by 20–40 percent on social networks. Live blogs gain shares when editors push permalinked key updates to social feeds and tag speakers. Recaps gain shares when authors include numbered takeaways, data points, and short quotes suitable for reposting. Each tactic increases the content’s immediate and downstream share potential.
What role do platform algorithms play in share performance?
Algorithms prioritise engagement signals: watch time for video, dwell time for live blogs, and click-through rate for recaps; these signals affect distribution and therefore share counts.
Social platforms rank video by total watch time and completion rate. News aggregators rank live blogs by fresh timestamps and frequent updates. Search engines rank recaps by topical relevance, structured data, and backlinks. Content that generates strong engagement signals receives amplified distribution, which increases potential shares. Format-specific optimisation aligns content with platform ranking criteria.
How does event type determine the optimal format?
Fast-paced, breaking events favour live blogs and live video; keynote-driven events favour highlight video and recaps with quotes and statistics; data launches favour graphics within recaps and short video explainers.
Breaking announcements require minute-by-minute reporting and raw footage. Keynote sessions with named speakers produce quotable soundbites that work well as highlight clips and as paragraph-form recaps. Research releases or market reports benefit from charts embedded in recaps and short explainer videos for social sharing. Align format to event tempo and content type to maximise shares.
What are cost-benefit considerations for organisers and publishers?
Evaluate budget per share: video has higher production cost but higher immediate share velocity; live blogs have medium staffing cost and strong professional reach; recaps have low cost and long-term value per share.
Calculate total content cost, expected share volume, and lifetime referral traffic. Video requires higher upfront investment but produces high early visibility. Live blogs need live staff and editorial oversight, delivering targeted shares during events. Recaps need less budget, offering steady SEO benefits and slow-burn shares over weeks. Choose formats that match financial constraints and desired temporal reach.
How do verification and journalistic standards affect format credibility?
Live blogs and recaps can include sourced quotes, timestamps, and links for verification; video requires clear on-camera attribution and retainable footage for fact-checking.
Verification requires named sources, timestamps, and accessible evidence. Live blogs use inline sourcing and archived updates. Recaps cite studies and provide links to original documents. Video must capture on-record statements and preserve raw files. Content with clear sourcing increases trust and attracts shares from professional and editorial accounts.
When is a mixed-format strategy optimal?
Mixed-format strategies increase shares by combining live video for immediacy, live blog for factual record, and recap for analysis and SEO value.
Using live video during the event captures attention and starts share momentum. Running a live blog provides a searchable, timestamped record and supports journalists. Publishing a recap within 24–48 hours consolidates key findings, adds context, and boosts long-term discoverability. This three-stage approach distributes workload across teams and leverages each format’s strengths for cumulative shares.
Explore More Expert Insights:
How to Build a Pre-Event Media Strategy That Fills Seats and Generates Coverage
Video, Written, Social: Which Event Coverage Format Gets Most UK Shares?
What case uses demonstrate format outcomes in the UK?
Examples: a political debate produced viral short clips; an industry conference used a live blog to inform trade press; a research launch used a recap with data charts to generate backlinks and ongoing shares.
Political debates produced share spikes within hours through short video clips shared on social platforms. Industry conferences that ran live blogs saw higher pick-up in trade outlets the same day. Research releases packaged as data-rich recaps produced backlinks from 10–25 industry blogs over 14 days. These examples show measurable differences by format aligned to event type.
How should teams measure ROI for coverage formats?
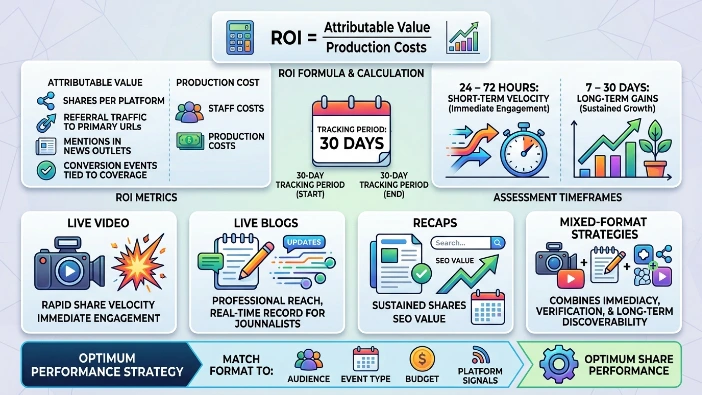
Measure ROI by dividing attributable value (leads, referral traffic, and PR mentions) by production cost, tracking shares, referral visits, and earned media over 30 days.
Track shares per platform, referral traffic to primary URLs, mentions in news outlets, and any conversion events tied to the coverage. Compare against production and staff costs. Assess short-term velocity (24–72 hours) and long-term gains (7–30 days). Use these metrics to guide future format investment decisions.
Live video produces rapid share velocity for immediate engagement. Live blogs offer professional reach and a real-time record for journalists. Recaps produce sustained shares and SEO value. Mixed-format strategies combine immediacy, verification, and long-term discoverability. Match format selection to audience, event type, budget, and platform signals for optimum share performance.
For deeper educational context on why many event stories fail editorial pickup, see:
Why 80% of UK Corporate Event Stories Never Reach a Single News Outlet
For a case-study analysis of an event that secured broad media coverage, see:
How One UK Industry Summit Secured 38 Published News Articles in 5 Days



