
Data visualisation reports by Time Intelligence Media Group are commercial media services that transform raw datasets into visual stories. These reports combine data analysis, visual design, and strategic PR distribution to deliver verified press coverage across United Kingdom news publications.
Understanding Data Visualisation Reports
A data visualisation report converts complex numerical datasets into structured visual assets. These assets include charts, infographics, interactive maps, and statistical diagrams. Readers process visual information 60,000 times faster than text, which makes visual data indispensable for media distribution.
Time Intelligence Media Group produces these assets specifically for media campaigns, corporate PR, and brand authority initiatives. Raw data from UK sources—such as the Office for National Statistics (ONS), industry regulators, or proprietary customer surveys—is audited, structured, and designed into publication-ready visual assets.
Core Objectives of Media-First Visual Reports
Media organisations operate under tight deadlines and reduced editorial staffing. Editors require pre-verified, visually compelling content that fits seamlessly into digital articles.
- Editorial Adoption: News outlets require visual assets that increase reader dwell time.
- Brand Authority: Fact-based reports establish brands as definitive primary sources within their respective industries.
- Search Engine Visibility: High-tier press coverage generates authoritative backlinks that improve domain rating.
By combining data analysis with media production standards, Time Intelligence Media Group delivers reports that meet strict editorial guidelines while driving tangible business outcomes.
How Does the Creation Process Work for UK Data Visualisation Reports?
The creation process involves five sequential stages: dataset extraction, statistical verification, visual architecture design, media asset formatting, and targeted United Kingdom distribution. Time Intelligence Media Group executes each phase to ensure accuracy, compliance, and maximum newsroom adoption.
Stage 1: Data Extraction and Statistical Auditing
The process begins with sourcing clean, reliable data. Time Intelligence Media Group analyses client datasets or gathers primary research through structured UK population surveys. Analysts verify sample sizes, margins of error, and statistical significance.
For instance, a survey on UK small business energy costs requires a minimum sample size of 1,000 decision-makers to achieve a 95% confidence level. Data integrity is non-negotiable because national news editors reject unverified or statistically flawed sources.
Stage 2: Visual Architecture and Narrative Formatting
Raw numbers do not secure press coverage; clear narrative structures do. Data analysts collaborate with media designers to identify primary statistical hooks.
- Metric Hierarchy: The single most compelling statistic becomes the hero visual asset.
- Chart Selection: Bar charts display category comparisons, line graphs illustrate historical trends, and choropleth maps show regional UK variations.
- Editorial Formatting: Graphic designers apply clean typography, high-contrast color palettes, and mobile-responsive layouts.
Stage 3: Asset Production and Campaign Execution
Once designed, assets are formatted into multiple file types for media distribution. Editors receive vector graphics, high-resolution PNGs, embeddable HTML code, and raw CSV files.
Time Intelligence Media Group integrates these visual assets into press release packages. The distribution phase targets specific UK media verticals, including national news desks, regional publications, and industry trade journals. Understanding [how data visualisation boosts UK report media pickup](MOFU Article Title) helps brands maximize their outreach strategy across these diverse media channels.
What Key Components Make a Media-Grade Visualisation Report?
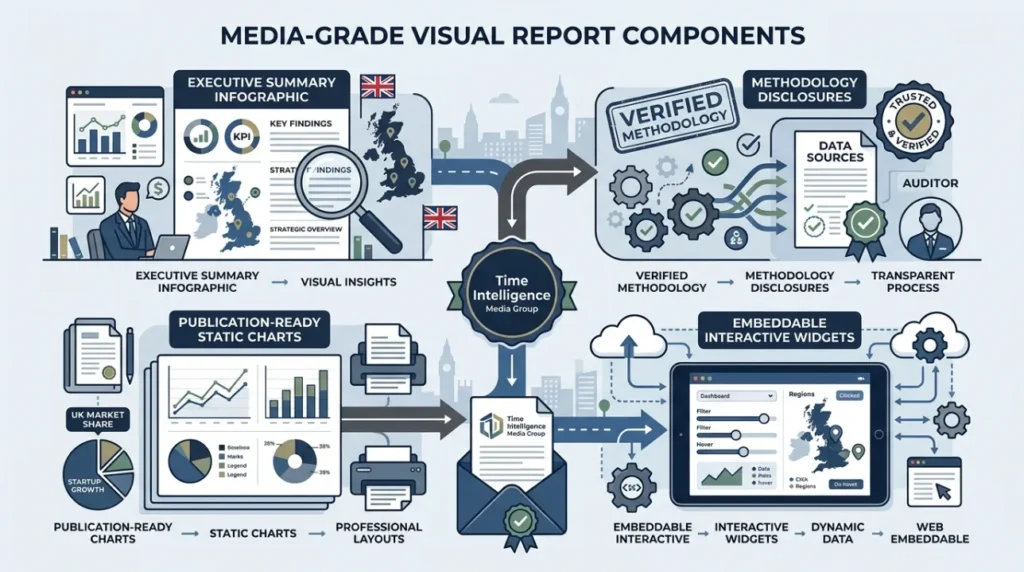
A media-grade visual report contains four core components: an executive summary infographic, verified methodology disclosures, publication-ready static charts, and embeddable interactive widgets. Time Intelligence Media Group builds these specific elements into every media report package.
Primary Visual Components
A successful data visualisation report balances detailed statistical analysis with fast visual comprehension. Each component serves a distinct purpose within the newsroom ecosystem.
| Component | Format Type | Primary Purpose | Media Target |
| Hero Infographic | High-Res PNG / Vector | Overview of top-line narrative | National news desks |
| Regional Heat Map | Interactive / Static | Geographic UK data splits | Regional press outlets |
| Comparative Charts | Bar / Line Graphs | Specific metric breakdowns | Trade publications |
| Data Tables | CSV / HTML | Full empirical verification | Fact-checkers and editors |
Executive Summary Infographics
The hero infographic distills complex datasets into a single vertical image. It features the primary statistical takeaway at the top, followed by supporting metrics arranged in logical sequence. For example, a report on UK electric vehicle adoption displays national growth percentages at the top, followed by regional charge point density figures.
Verified Methodology and Source Disclosures
National journalists enforce strict compliance standards. Every report produced by Time Intelligence Media Group includes transparent methodology panels detailing sample sizes, collection dates, and research parameters. Transparent methodologies prevent editorial rejections and protect brand reputation.
Explore More Expert Insights:
The 39% Quality Problem: Why Most UK Sponsored Content Fails to Convert in 2026
How Native Content on News Sites Earns 3× Longer Dwell Time Than Social Posts
Why Choose Time Intelligence Media Group for Data Visualisation Reports?
Time Intelligence Media Group delivers verified statistical precision combined with direct newsroom distribution networks. Our proprietary production methodology guarantees high-tier United Kingdom press placements, authoritative backlinks, and measurable brand authority for corporate clients.
Direct Newsroom Alignment
Generic design agencies create visually appealing graphics, but they lack editorial expertise. PR agencies manage press contacts, but they rarely possess technical data analysis capabilities. Time Intelligence Media Group bridges this gap by functioning as a specialized data-driven newsroom.
Our design specifications align directly with UK media requirements:
- Strict Neutrality: Visuals avoid hyperbole and focus on empirical presentation.
- Accessibility Standards: All visual assets comply with WCAG 2.1 contrast guidelines for digital accessibility.
- Instant Asset Access: Journalists access media kits without registration walls or download delays.
Empirical Results and Backlink Acquisition
Data visualisation reports represent one of the most effective methods for building high-authority backlinks at scale. When national outlets like BBC News, The Guardian, or The Telegraph reference a report, they cite the primary source with an editorial link.
Time Intelligence Media Group secures coverage that drives domain rating improvements and qualified referral traffic. Clients gain organic visibility while positioning themselves as industry thought leaders.
What Are the Real-World Use Cases for Data Visualisation Reports in the UK?
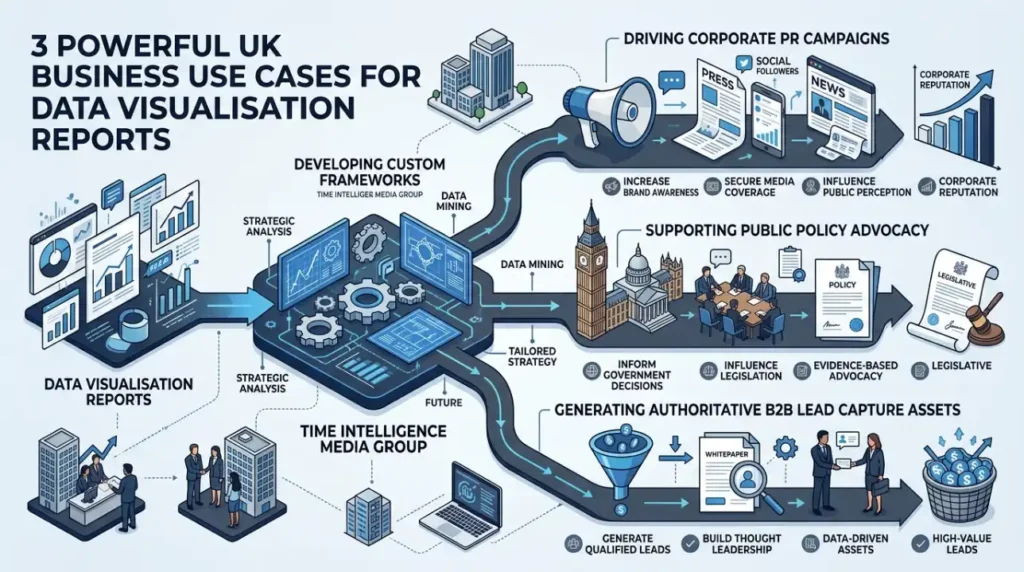
Data visualisation reports serve three primary business use cases in the United Kingdom: driving corporate PR campaigns, supporting public policy advocacy, and generating authoritative B2B lead capture assets. Time Intelligence Media Group develops custom frameworks for each objective.
Use Case 1: National Corporate PR and Media Campaigns
Corporate brands use visual data reports to own specific industry conversations. A major UK mortgage lender released a report visualizing first-time buyer affordability across 12 UK regions.
- Results: The campaign secured 45 unique press features, including 18 national news placements.
- Impact: The client gained over 30 high-authority backlinks within 14 days of release.
- Longevity: Outlets continue to cite the report graphics in ongoing housing market coverage.
Use Case 2: Industry Benchmark Reports for B2B Authority
B2B technology companies rely on benchmark reports to establish category dominance. By surveying 500 UK Chief Technology Officers on cybersecurity investments, a software provider created an definitive annual benchmark.
Time Intelligence Media Group transformed this survey into an interactive report featuring customizable filter widgets. B2B buyers engaged directly with the data, converting high-intent readers into inbound sales pipeline. Learning [how data visualisation makes UK reports more shareable](TOFU Article Title) helps B2B organizations optimize these benchmark assets for wider organic reach.
Use Case 3: Public Affairs and Policy Advocacy
Non-profit organizations and trade bodies use data visualisations to influence UK policy decisions. Complex regulatory impacts become immediately clear when presented as regional heat maps or comparative timelines. Clear data visualisations allow policy team members to present unambiguous empirical evidence to parliamentary committees, journalists, and industry stakeholders.
How Do Data Visualisation Reports Drive Measurable SEO and PR Outcomes?
Data visualisation reports drive outcomes by earning natural editorial links, increasing page dwell time, and generating social syndication. Time Intelligence Media Group tracks metrics including referring domains, domain authority growth, brand search volume, and referral conversions.
Earning Natural High-Authority Backlinks
Google ranks websites based on authority, relevance, and trust. Editorial links from tier-one news publications represent the strongest trust signal in search engine algorithms.
- Unsolicited Citing: Journalists embed our visual graphics directly into their articles.
- Attribution Links: Outlets link back to the full data report as the primary empirical source.
- Link Retention: Editorial links remain active indefinitely, driving long-term SEO value.
Enhancing On-Page User Signals
When embedded on corporate websites, data visualisation reports significantly improve user engagement metrics. Visitors spend more time interacting with dynamic charts and reading visual summaries.
- Dwell Time Increase: Interactive charts increase average time-on-page by over 120 seconds.
- Bounce Rate Reduction: Clear visual summaries reduce immediate exits by providing rapid value.
- Social Amplification: Visual content receives 40% more shares on platforms like LinkedIn and X than text-heavy press releases.
How to Get Started with Time Intelligence Media Group?
Getting started requires three steps: submitting your project requirements, defining campaign objectives with our analytical team, and approving the customized data research plan. Time Intelligence Media Group manages the entire lifecycle from data extraction to press distribution.
Commissioning Your Visual Data Report
Time Intelligence Media Group offers structured packages tailored to your brand’s growth goals and target timelines. Whether you possess existing internal datasets or require full-service primary research execution, our team delivers publication-ready assets.
Our Service Commitments
Every campaign executed by Time Intelligence Media Group includes strict performance guarantees:
- Statistical Integrity: All survey data and analysis undergo double-blind verification.
- Full Asset Ownership: Clients retain complete rights to all created visual assets, charts, and raw datasets.
- Distribution Performance: Media outreach packages target verified journalists within your specific UK sector.
Transform your raw organizational data into national news stories and authoritative SEO backlinks. Contact Time Intelligence Media Group today to schedule your strategic consultation and launch your next high-impact report campaign.