
Time Intelligence Media Group applies a five-step measurement framework objective setting, distribution tracking, coverage attribution, audience and engagement metrics, and outcome reporting with ROI calculations. Each step uses defined KPIs and time-bound targets.
The framework begins with clear objective setting. Objectives align with client goals such as lead generation, brand awareness lift, or event attendance. Each objective receives one primary KPI and two secondary KPIs. Distribution tracking records every outbound asset, channel, and schedule. Coverage attribution links placements to distribution lists and timestamps. Audience and engagement metrics quantify unique impressions, engagements, and share of voice. Outcome reporting converts media results into business metrics such as website sessions, qualified leads, or pipeline value. The final output is an ROI calculation presented with data tables and source citations.
How are objectives and KPIs defined for UK clients?
Objectives are specific, time-bound, and tied to business outcomes; KPIs include placement count, unique reach, referral sessions, conversion rate, and pipeline value with numeric targets.
Each campaign begins with a documented objective statement and timeframe. For example, a product launch objective reads: “Secure 10 UK trade placements and 3 national features within 60 days to generate 150 referral sessions.” Primary KPIs measure media outputs such as placements and unique reach. Secondary KPIs measure behavioral outcomes such as referral sessions from coverage and conversion rate on landing pages. Business KPIs include qualified leads and estimated pipeline value calculated using average deal size. All KPIs include baseline values and incremental targets.
How is distribution tracked across channels and outlets?
Distribution tracking logs each press release, email pitch, and broadcast outreach with channel type, recipient list, send time, and delivery status in a central campaign log.
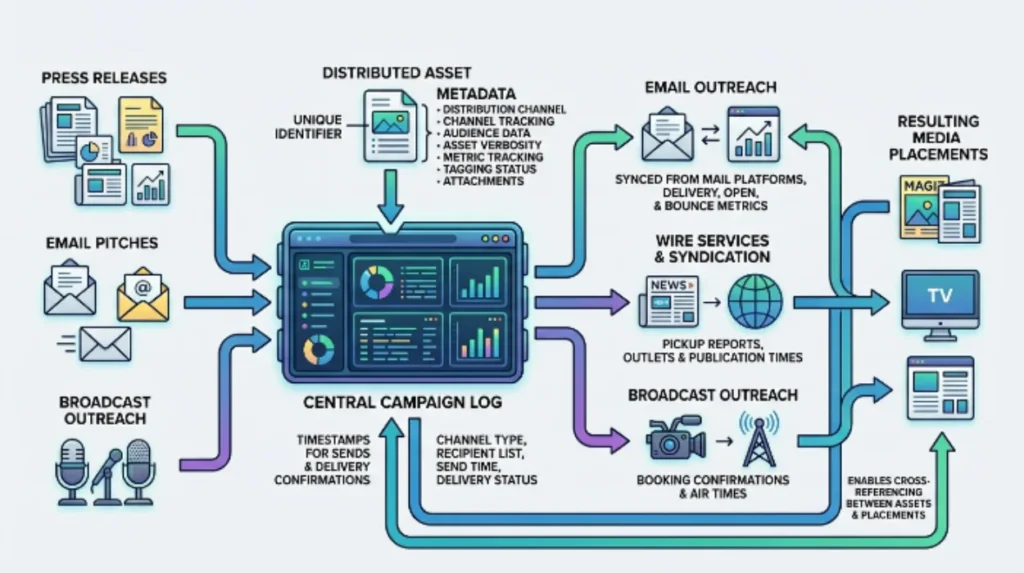
Each distributed asset receives a unique identifier and metadata including distribution channel, recipient segment, embargo status, and attachments. The central campaign log stores timestamps for sends and delivery confirmations. For email outreach, delivery, open, and bounce metrics sync from mail platforms. For wire services and syndication, pickup reports list outlets and publication times. Broadcast outreach records booking confirmations and air times. The campaign log enables cross-referencing between distributed assets and resulting media placements.
How does the group attribute coverage to specific distribution activities?
Attribution uses URL tracking, time-window matching, and reporter contact records to link coverage to distribution events with primary, secondary, and inferred attribution tiers.
URL parameters and UTM tags on client links identify referral traffic from specific placements. Time-window matching checks publication timestamps against distribution sends within a predefined window, typically 72 hours. Reporter contact records and email threads provide direct attribution when journalists confirm receipt and publication. Attribution tiers classify coverage as primary when direct evidence exists, secondary when timing and content alignment indicate likely influence, and inferred when correlation is strong but direct proof is absent. Each placement includes an attribution tag and evidence links in reports.
What audience and engagement metrics are measured?
Measured metrics include unique impressions, estimated audience size, referral sessions, average session duration, social shares, and engagement rate per placement.
Unique impressions derive from outlet circulation and digital unique visitor data. Estimated audience size uses outlet-reported figures and third-party analytics. Referral sessions come from web analytics and UTM tracking. Engagement metrics include average session duration, pages per session, and bounce rate for referral traffic. Social metrics capture shares, comments, and reach across platforms for placements that generate social activity. Each placement report shows raw counts and normalized rates per 1,000 impressions for cross-outlet comparison.
How are qualitative factors captured and scored?
Qualitative factors such as message alignment, sentiment, spokesperson accuracy, and prominence receive standardized scores and narrative annotations in coverage reports.
Analysts review each placement and score message alignment on a 1–5 scale based on presence of key messages. Sentiment analysis assigns positive, neutral, or negative labels based on lexical indicators and context. Spokesperson accuracy checks quotes against prepared statements and rates accuracy on a 1–3 scale. Prominence records whether the coverage is headline, feature, mention, or sidebar. Narrative annotations summarize context such as competitor mentions or regulatory angles. Combined qualitative scores form a placement quality index used alongside quantitative metrics.
How does audience segmentation influence measurement and reporting?
Audience segmentation separates results by target cohorts such as trade professionals, consumers, and C-suite decision-makers and reports metrics and conversions per cohort.
Segmentation uses outlet audience profiles, contextual tags, and referral user data to assign placements to cohorts. For trade audiences, measurement focuses on specification downloads, demo requests, and procurement contacts. For consumer audiences, measurement emphasises referral traffic, conversion rates on e-commerce pages, and social engagement. For executive audiences, reporting tracks whitepaper downloads, meeting requests, and inbound sales contacts. Each cohort receives a dedicated section in campaign reports with cohort-specific KPIs and outcomes.
How are media value and ROI calculated?
Media value combines earned media equivalence, incremental website conversions, and estimated pipeline contribution to compute a composite ROI with transparent assumptions.
Earned Media Value (EMV) calculates the cost equivalent of paid advertising for the placement’s reach using outlet rate cards and standard CPM benchmarks. Incremental conversions use controlled baselines or A/B timing to isolate coverage-driven traffic and apply conversion rates to estimate lead counts. Pipeline contribution multiplies leads by average deal size and conversion-to-deal rates to estimate revenue influence. The composite ROI divides estimated revenue influence by total campaign spend. Reports list all assumptions, CPMs used, and conversion rates for auditability.
What tools and integrations support measurement workflows?
Measurement uses integrated tools: web analytics for referral tracking, media monitoring for placement capture, CRM for lead attribution, and BI tools for dash boarding and reporting.
Web analytics platforms provide UTM-based referral data and user behaviour metrics. Media monitoring captures published placements, screenshots, and syndication paths. CRM systems store inbound contacts and lead qualification data. Business Intelligence (BI) tools combine these inputs into dashboards with time-series charts and cohort breakdowns. Integration layers use APIs and automated ETL processes to maintain near-real-time data flow. Secure data exports supply clients with raw datasets for internal verification.
Explore More Expert Insights:
Time Intelligence Media Group vs Traditional UK Newswires: What’s Different
Inside Time Intelligence Media Group’s UK Journalist Network
How are results reported to UK clients and stakeholders?
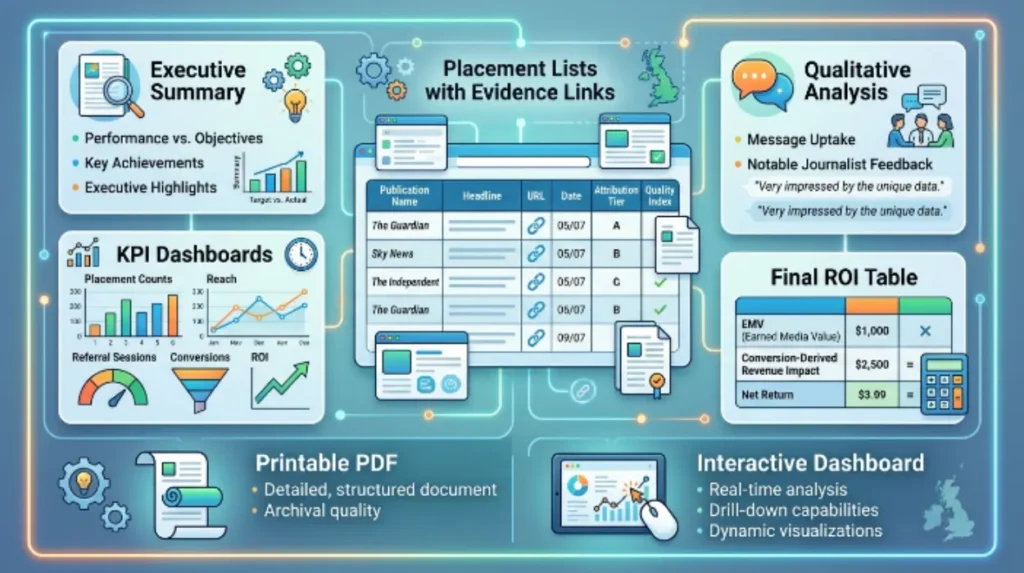
Reports combine executive summaries, KPI dashboards, placement lists with evidence links, qualitative analysis, and a final ROI table delivered in PDF and interactive dashboard formats.
Each report begins with an executive summary of performance versus objectives. KPI dashboards show placement counts, reach, referral sessions, conversions, and ROI. Placement lists include publication name, headline, URL, date, attribution tier, and quality index. Qualitative analysis highlights message uptake and notable journalist feedback. The ROI table details EMV, conversion-derived revenue impact, and net return. Clients receive both a printable PDF and access to an interactive dashboard for drill-down analysis.
What use cases demonstrate the measurement approach delivering business outcomes?
Use cases include product launches where 15 trade placements generated 420 referral sessions and 18 demo requests, and sector campaigns where national coverage increased branded searches by 210% and contributed £150,000 pipeline value.
In product launches, linking placements to demo requests allows direct sales follow-up and shortens procurement cycles. In sector campaigns, increased branded search signals awareness lift and improves long-term funnel performance. Measurement also supports crisis communications by tracking sentiment shifts and stakeholder reach. In thought-leadership campaigns, whitepaper downloads tied to placements validate executive positioning and generate meeting requests. Each use case uses the same measurement framework with tailored KPIs.
Check the Complete Explanation:
How UK Trade Press Differs From National Media for Product Launches
Time Intelligence Media Group measures PR distribution results through a structured framework encompassing objective setting, distribution tracking, attribution, audience metrics, qualitative scoring, and ROI calculation. Measurement uses URL tracking, time-window matching, CRM linkage, and standardized scoring to produce auditable reports. Reporting delivers both summarised dashboards and detailed placement evidence to support decision-making.
For guidance on channel selection and database evaluation, see: