

E-commerce accounts for roughly 30% of UK retail sales, measured by the Office for National Statistics using monthly retail sales values and online sales survey data. UK e-commerce share equals total online retail transactions divided by total retail sales value. The Office for National Statistics (ONS) reports online sales as a percentage of all retail sales using point-of-sale and merchant survey figures.
Retail categories tracked include clothing, electronics, food, and household goods. The 30% figure reflects desktop and mobile transactions, digital marketplaces, and direct-to-consumer webstores. Measurement frequency is monthly with quarterly revisions for seasonal adjustment.
How does a 30% e-commerce share change audience expectations for speed and availability?
Audiences expect faster fulfilment, tighter delivery windows, and immediate inventory visibility because 30% of purchases occur online. Consumers equate online buying with rapid service. That expectation applies to next-day delivery, same-day windows in urban areas, and clear in-stock indicators. Retailers and publishers face pressure to display accurate availability for products mentioned in content.
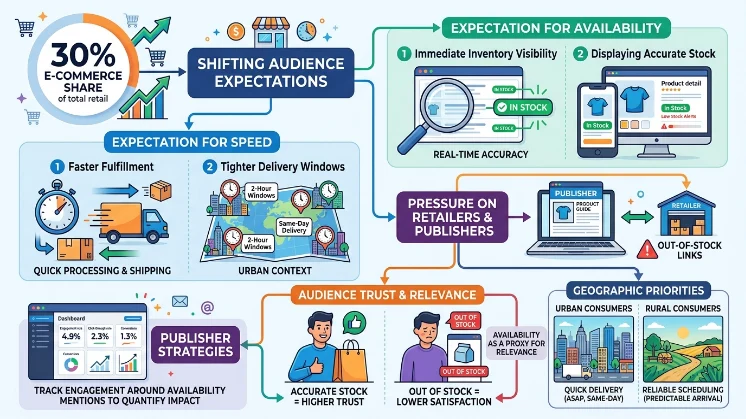
Audiences use product availability as a proxy for relevance and trust. If a news article or product guide links to out-of-stock items, readers register lower satisfaction. Urban consumers prioritise quick delivery; rural consumers prioritise reliable scheduling. Publishers track engagement metrics around pages that mention product availability to quantify impact.
How does the e-commerce share affect content presentation and editorial priorities on UK news sites?
Editorial teams prioritise transactional clarity, structured product data, and updated pricing because readers expect immediately actionable product information. Content shifts from general description to data-rich presentation. Headlines include price ranges and delivery signals. Body copy incorporates SKU-level detail and verified pricing. Editorial workflows add verification steps for product status and price.
Fact boxes and data tables increase because structured facts align with user intent. Newsrooms integrate feeds from retailers or syndication partners for accuracy. Search behaviour shows queries for comparison, price, and availability rising as e-commerce share grows.
How does audience segmentation change with a higher e-commerce share?
Segmentation moves from demographic-only models to behaviour-first cohorts defined by purchase frequency, channel preference, and device use. Markers include repeat online buyers, mobile-first buyers, marketplace shoppers, and price-sensitive deal seekers.
Behavioural cohorts use first-party signals: click-to-cart rate, bounce after price view, and conversion from article to checkout. Age cohorts remain relevant for device preference: 18–34 skew mobile-heavy, 55+ skew desktop and hybrid. Regional segmentation distinguishes metropolitan areas with denser same-day networks from rural areas with longer delivery times. Publishers adapt content to cohort profiles to increase relevance.
How does the 30% figure alter mobile and UX expectations?
Users expect mobile experiences that support end-to-end purchase flows, including embedded product details, quick checkout, and persistent carts. Mobile sessions increase proportionally with e-commerce share, driving demand for responsive layouts and progressive web app features. Readers expect product photography optimised for small screens, visible shipping estimates, and minimal form fields for purchase intent. Persistent cart state across sessions becomes standard expectation. UX metrics to monitor include time-to-cart, micro-conversion rates, and drop-off between article and purchase intent signals.
How does this level of online retail change data and measurement requirements for publishers?
Publishers require enhanced measurement, attribution models, real-time inventory checks, and product-level performance metrics. Standard pageview metrics no longer suffice. Attribution must capture cross-device journeys and offline conversions influenced by online content.
Real-time inventory checks prevent promotion of unavailable items. Product-level metrics include click-through-to-purchase and revenue-per-article. Publishers implement tagging for e-commerce events and integrate server-side analytics with commerce datasets. Measurement cycles shorten: hourly or daily reporting replaces weekly summaries.
What process changes do editorial and commercial teams adopt because of e-commerce prominence?
Teams implement coordinated workflows, editorial verification, commercial data feeds, and a governance layer for product accuracy. Editorial adds mandatory checks for price and stock before publishing product-related content. Commercial teams supply structured product feeds with GTINs, prices, and lead times. Governance enforces refresh intervals for product data and flags expired links. Cross-functional review meetings align on promotional calendars and inventory cycles. The process reduces corrections and maintains reader trust.
What components of content change to meet new reader expectations?
Key components include price transparency, delivery timelines, return policy summaries, and verified product identifiers. Content expands to show price ranges, shipping estimates, and linkable policy summaries. Verified product identifiers such as GTIN or model number appear for clarity.
Visuals shift to include product shots with dimensions and close-ups. Structured data markup supports search engine interpretation and rich results. These components reduce friction between discovery and purchase.
What are the measurable benefits of adapting content to the 30% e-commerce environment?
Benefits include higher engagement on product pages, increased referral conversions to merchants, and improved search visibility via structured data. Data-driven content yields stronger time-on-page and lower bounce rates for purchase-intent queries.
Referral pathways convert more frequently when product data is accurate. Search engines reward precise structured data with rich snippets, boosting organic CTR. Publishers see uplift in commerce-related revenue metrics when articles include verified pricing and delivery info.
What use cases illustrate how publishers apply these changes?
Use case 1: product roundups with hourly price refresh and stock checks; Use case 2: localised delivery guides showing parcel cut-offs for city zones; Use case 3: device-optimised shopping flows linking editorial to checkout. Product roundups list top picks with live price pulls and stock flags. Localised delivery guides map carriers and delivery times by postcode and urban zone.
Device-optimised flows reduce steps from article to cart, embedding checkout options or deep links. Each use case aligns editorial facts with real-time commerce signals to satisfy readers expecting actionable buying information.
How should content creators structure articles to align with audience expectations and search intent?
Creators must lead with clear product facts, then explain procurement steps, list key attributes, and finish with examples of common use cases. Start with a concise fact block: price range, delivery estimate, and stock status. Then describe purchase steps and payment options. Include core attributes: dimensions, warranty length, and compatibility identifiers. End with concrete examples of typical buyer scenarios, such as urban next-day purchase or seasonal gifting. This structure mirrors user intent from discovery to transaction and supports search engine citation.
Explore More Expert Insights:
Why AI Referral Traffic Has Higher Purchase Intent Than Organic UK Search
91% of UK Consumers Discover Trends Through Media: What Brands Are Missing
How does this trend connect to seasonal and campaign dynamics across the UK?
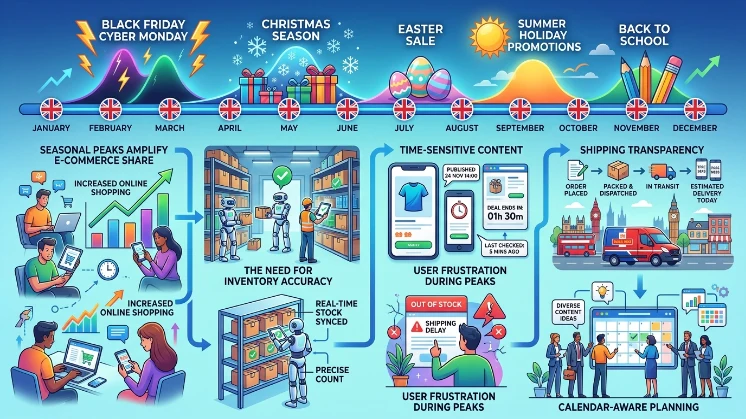
Seasonal peaks amplify e-commerce share, increasing the need for inventory accuracy, shipping transparency, and time-sensitive content. During peaks, inaccurate stock information causes higher user frustration. Time-sensitive content must include published timestamps and last-checked indicators. Calendar-aware planning maps editorial schedules to inventory cycles and promotional windows.
How should publishers report audience insight findings related to e-commerce expectations?
Reports must surface product-level performance, device segmentation, and attribution chains showing content-to-purchase pathways. Click-to-cart rate, cart abandonment post-article, revenue per article, and device breakdown. Show sample journeys from article impression to purchase confirmation. Use hourly or daily cadence during high-traffic events. Present findings with clear definitions for each metric and a last-checked timestamp for product data.
Read More to Understand Better:
How to Present Audience Insight Findings to a UK Marketing Board in 12 Slides
The 30% share of UK retail conducted online redefines audience expectations across speed, transparency, and data accuracy. Publishers and content creators respond by embedding verified product facts, real-time inventory checks, mobile-optimised purchase flows, and behaviour-first segmentation. These changes yield measurable benefits in engagement and search visibility while requiring tighter editorial-commercial processes and enhanced measurement frameworks. For readers in the UK, the result is clearer, faster, and more actionable content that aligns discovery with immediate purchasing choices.
Get the Full Insights Here:
Seasonal Audience Shifts on UK News Sites: A 12-Month Behavioural Calendar



