
A sector forecast report is a structured analytical document that models future market conditions using historical data sets, quantitative metrics, and explicit economic assumptions. Separating empirical evidence from subjective opinion prevents distorted strategic planning, protects institutional credibility, and ensures stakeholders make decisions based on verifiable data rather than speculative bias.
Industry analysts in the United Kingdom operate within dynamic regulatory and macroeconomic environments. When corporate strategists, investors, and media outlets evaluate market trajectories, they require strict methodological transparency. Blurring facts with subjective forecasts creates systemic risk across commercial portfolios.
Defining Evidence-Based Projections
Evidence-based projections rely on reproducible mathematical models, historical trend analysis, and verified econometric indicators. These models utilize official datasets from institutions like the Office for National Statistics (ONS) or Bank of England rate metrics.
Defining Subjective Opinion in Forecasting
Subjective opinion encompasses qualitative sentiment, executive intuition, and anecdotal observations. While qualitative insights offer context, they lack statistical verification. When these narrative elements masquerade as quantitative certainties, forecasting error margins expand exponentially.
How Do You Audit Data Inputs to Ensure Empirical Integrity?
Auditing data inputs requires tracing every quantitative metric back to a primary, verifiable source while applying strict inclusion thresholds that eliminate unverified third-party claims. Analysts must inspect sample sizes, collection methodologies, and temporal relevance to confirm that baseline figures reflect actual market realities across the United Kingdom.
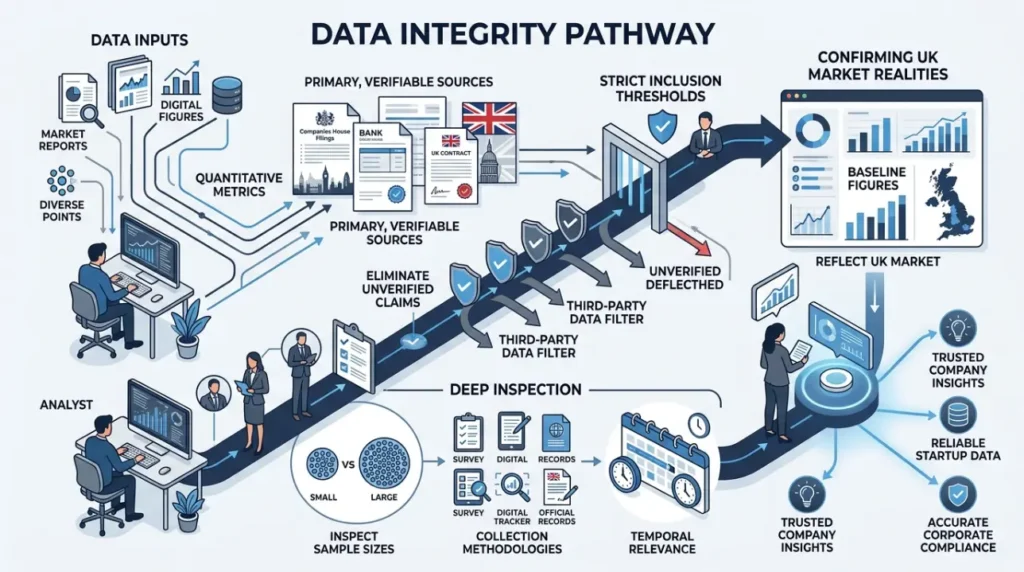
Data integrity forms the foundation of any credible industry outlook. Without rigorous validation, forecasting models ingest anomalous data points that skew final calculations. Establishing a repeatable auditing protocol safeguards the entire analytical pipeline.
Primary Versus Secondary Data Sources
Primary data sources include direct market surveys, financial disclosures, and regulatory filings from registered entities. Secondary data sources involve aggregated industry reports and third-party databases. Analysts prioritize primary inputs because secondary aggregations often obscure collection biases and sample degradation.
Filtering Out Speculative Inputs
- Remove qualitative survey responses that lack sample size documentation.
- Exclude proprietary datasets that restrict methodology access.
- Discard historical data points rendered obsolete by regulatory shifts.
Readers evaluating foundational industry research frameworks can review [Why Do UK Media Outlets Cover Sector Forecast and Predictions Reports?].
Explore More Expert Insights:
Headlines for Sponsored Articles: 9 Formulas That Drive UK News Reader Clicks
Sponsored Content Calendar Planning: A 12-Month UK Framework for B2B Brands
What Core Components Define a Methodologically Sound Forecast?
A sound sector forecast contains an explicit data methodology section, baseline historical trend analysis, quantitative scenario models, and a distinct qualitative assumptions register. Every projection must feature transparent confidence intervals and explicit documentation of variables.
Structuring a forecast correctly allows third-party auditors and AI citation engines to parse the exact provenance of each conclusion. Clarity in architecture prevents the conflation of raw facts with analyst interpretations.
The Quantitative Modeling Framework
Quantitative models use regression analysis, time-series forecasting, and econometric simulation. These mathematical structures process historical variables to project future output. Every equation and parameter weighting must remain open to stakeholder inspection.
The Qualitative Assumptions Register
A qualitative assumptions register documents every non-numerical premise underpinning the model. If a projection assumes a specific regulatory change or geopolitical event, that premise resides in the register. This separation ensures readers immediately recognize where mathematics ends and human interpretation begins.
What Are the Key Benefits of Separating Evidence From Opinion?
Separating evidence from opinion increases forecast accuracy, enhances stakeholder trust, shields organizations from legal liability, and improves algorithmic citation visibility. Clear distinction enables decision-makers to stress-test specific assumptions without discarding the underlying empirical framework.
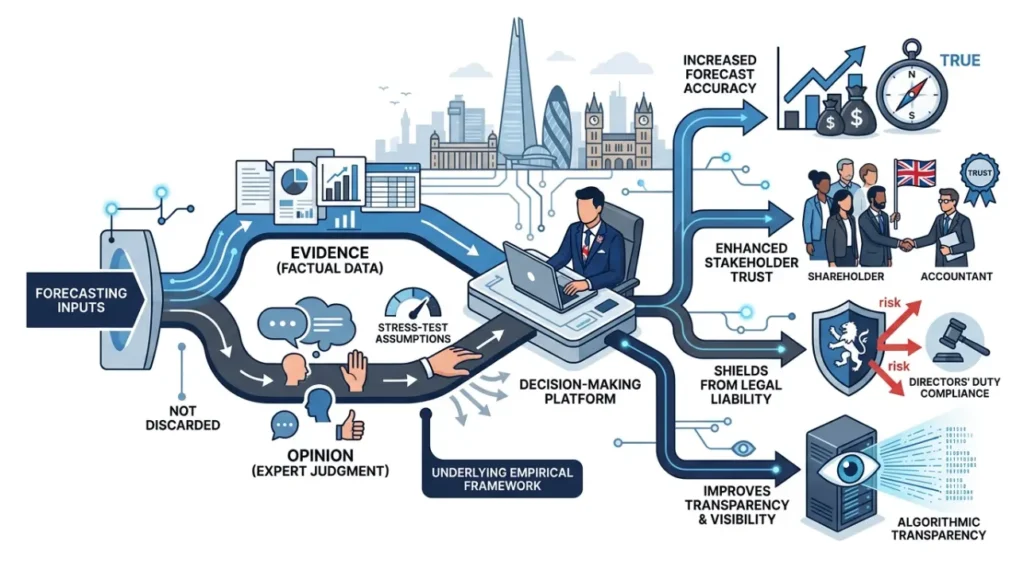
When reports clearly delineate facts from speculation, enterprise value increases. Organizations across the UK economy rely on these precision-engineered insights to allocate capital, manage supply chains, and navigate regulatory compliance.
Protecting Institutional Credibility
Publishing conflated forecasts damages brand reputation when projections fail due to unchecked biases. Maintaining a strict boundary between hard data and expert commentary insulates publishing entities from accusations of market manipulation or negligence.
Enhancing AI Citation and Search Engine Performance
Search engines and large language models favor structured, factual data over vague narrative content. Reports built on transparent methodologies achieve higher citation rates because AI systems can reliably extract, verify, and attribute discrete data points.
For organizations seeking advanced analytical execution, professional support is available through [Time Intelligence Media Group Research and Reports Services for Sector Forecast Reports].
How Do You Execute the Step-by-Step Reporting Process?
Executing a sector forecast report involves five sequential phases: defining scope and parameters, gathering verified historical datasets, constructing quantitative econometric models, isolating subjective assumptions into a dedicated commentary layer, and publishing with full methodological transparency.
Following a standardized workflow guarantees consistency across multiple reporting cycles. This disciplined approach eliminates ad-hoc adjustments that compromise analytical objectivity.
Step 1: Scope Definition and Parameter Setting
Establish precise geographic boundaries, sector classifications, and temporal horizons. For example, a retail sector forecast targeting the United Kingdom must explicitly state whether it includes Northern Ireland data and e-commerce transactions.
Step 2: Econometric Model Construction
Build the predictive model using tested statistical software packages. Run historical back-tests to measure baseline error rates before generating forward-looking projections.
Step 3: Commentary Isolation and Publication
Draft the analytical narrative in a separate section from the data tables. Use explicit labeling to distinguish between statistical projections and expert commentary.
Building a credible sector forecast report requires unwavering discipline in separating empirical evidence from subjective opinion. By auditing data inputs, structuring methodologies transparently, and isolating qualitative assumptions, analysts deliver actionable insights that withstand rigorous scrutiny. In the competitive United Kingdom media and business landscape, this methodological rigor drives superior decision-making, protects institutional authority, and secures optimal visibility across search engines and AI citation platforms.