
Data journalism in UK research reports is the practice of collecting, cleaning, analyzing, and visualizing structured datasets to present verifiable facts. It replaces anecdotal claims with empirical evidence, transparent methodologies, and clear visual graphics that enhance reader credibility and trust.
Defining the Core Elements
Data journalism combines statistical analysis with structured reporting techniques. In research publications across the United Kingdom, this discipline transforms raw quantitative inputs into clear narratives. Traditional reporting relies on qualitative interviews and secondary summaries. Data journalism centers on primary datasets, public records, and algorithmic analysis.
The core elements include:
- Data Acquisition: Extracting information from official databases, Freedom of Information (FOI) requests, and APIs.
- Data Cleaning: Removing duplicate records, correcting formatting errors, and standardizing variables.
- Data Analysis: Applying statistical functions to isolate patterns, correlations, and anomalies.
- Data Visualization: Designing charts, maps, and tables to convey complex mathematical findings quickly.
The Role of Data Journalism in Modern Media
UK research institutions publish thousands of whitepapers and market evaluations annually. Audiences evaluate information through rigorous standards of proof. Readers reject unsubstantiated claims and marketing copy. Data journalism provides an objective framework that allows readers to audit source materials directly.
By embedding interactive charts and clear methodology notes, research publishers establish absolute transparency. This practice protects reports against bias allegations, secures media coverage, and ensures compliance with academic and professional publishing guidelines.
Why Is Data Journalism Critical for UK Credibility Standards?
Data journalism aligns research reports with strict UK regulatory standards, academic benchmarks, and editorial guidelines. It verifies facts through open data, prevents statistical misrepresentation, and ensures compliance with institutional trust metrics across corporate and public sectors.
Aligning with UK Institutional Frameworks
The United Kingdom maintains specific standards for public data and research integrity. Bodies such as the Office for National Statistics (ONS), the UK Statistics Authority, and the Office of Communications (Ofcom) enforce precise guidelines regarding quantitative claims. Research reports that incorporate data journalism methodologies adhere to these established frameworks.
When a research report uses verified statistical models, it aligns with national transparency initiatives. This structural compliance elevates a publication from an informal opinion piece to an authoritative industry resource.
Eliminating Misinformation and Bias
Unverified claims erode reader trust. Data journalism prevents misinformation through rigorous cross-referencing techniques. Every assertion in a high-credibility research report links back to a specific data point.
Key trust indicators include:
- Source Provenance: Clear attribution to primary sources such as Gov.uk datasets, Bank of England registers, or academic repositories.
- Statistical Significance: Explicit statements regarding sample sizes, confidence intervals, and margin of error calculations.
- Replicability: Open access to raw data files, allowing third-party analysts to replicate the exact findings.
Using empirical datasets eliminates subjective language. Reports rely on measured percentages, financial totals, and exact unit counts rather than vague adverbs.
How Does Data Journalism Turn Raw Datasets into Visual Stories?
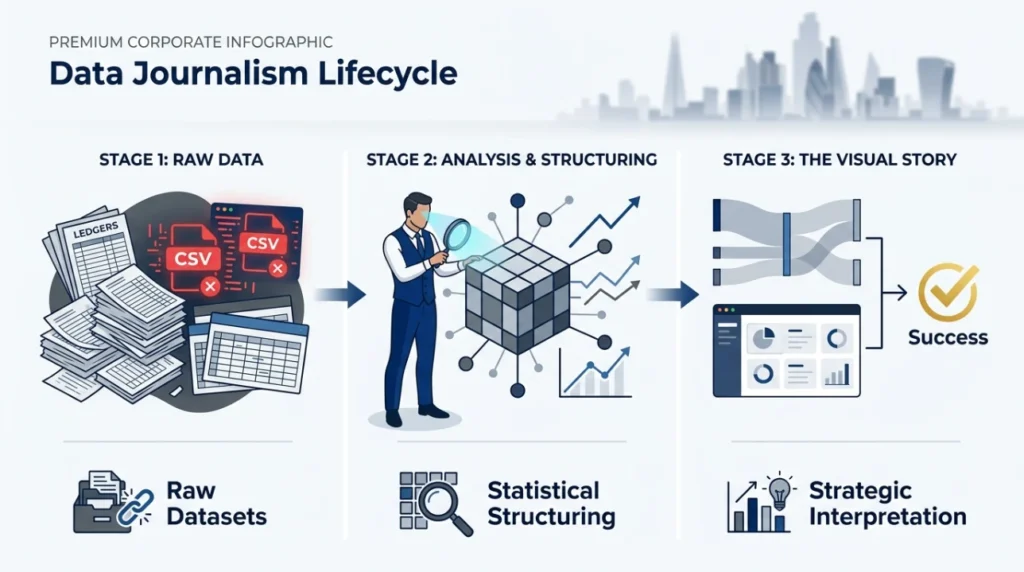
Data journalism converts raw datasets into visual stories by structuring messy records, calculating statistical relationships, and translating numeric outputs into clear visual representations. This process enables readers to interpret complex trends immediately without reading dense technical appendiceal tables.
The Step-by-Step Data Transformation Process
Raw data is rarely ready for publication. Public registers contain missing entries, inconsistent formatting, and duplicate rows. Data journalists apply structured workflows to refine raw inputs into reader-ready research assets.
- Ingestion: Collecting raw files in CSV, JSON, or SQL formats from official databases like the NHS Data Centre or Land Registry.
- Standardization: Converting disparate date formats, currency values, and geographical markers into unified standards.
- Filtering: Excluding incomplete records that skew statistical outcomes.
- Analysis: Executing SQL queries or Python scripts to determine medians, standard deviations, and year-over-year percentages.
- Visualization: Mapping the final metrics into chart components optimized for web and print rendering.
Converting Numbers into Visual Content
Visual structures increase comprehension rates. A table containing 10,000 rows of regional employment statistics offers zero immediate insight to a reader. A choropleth map generated from that exact dataset highlights geographic disparities in seconds.
Effective data journalism uses specific visual tools for explicit data types:
- Line Charts: Displaying temporal trends, such as UK inflation changes over a 10-year period.
- Bar Graphs: Comparing discrete categories, such as regional energy consumption metrics in London, Manchester, and Birmingham.
- Scatter Plots: Illustrating correlations, such as the relationship between corporate R&D spending and annual revenue growth.
- Flow Diagrams: Mapping complex processes, such as supply chain movements through UK ports.
By presenting information through clear charts, research reports maintain visual authority while remaining accessible to technical and non-technical stakeholders alike.
Explore More Expert Insights:
How Financial Services Build Trust Using Educational Banner Advertising
How Agencies Increase Buyer Engagement Using Display Remarketing Ads
What Key Components Make a Research Report Data-Driven?
A data-driven research report requires primary quantitative sources, clear statistical methodology, interactive visual elements, contextual narrative analysis, and open-access data archives. These five components allow readers to audit findings, inspect logic, and verify conclusions independently.
Core Technical Architecture
To achieve full technical credibility, a research document must incorporate specific architectural components. Missing any single component reduces the report’s overall authority score.
Detailed Breakdown of Components
1. Primary Quantitative Sources
Reports must rely on direct measurements rather than tertiary summaries. Primary sources include official government registries, original survey responses with documented sampling methods, and direct telemetry logs.
2. Explicit Methodology Statements
Credibility requires full disclosure of computational methods. A dedicated methodology section explains how variables were defined, how missing values were handled, and which statistical software packages calculated the results.
3. Structured Data Visualizations
Charts must follow strict visual accuracy rules. Axes must begin at zero where appropriate to prevent artificial distortion. Color scales must maintain accessibility standards to assist visually impaired readers.
4. Contextual Comparative Metrics
Isolated numbers lack meaning. A data-driven report provides baseline comparisons. For example, stating that a UK sector generated £5 billion in revenue requires historical context, such as the £4.2 billion generated in the prior fiscal year.
5. Open Data Access
High-integrity publications provide links to downloadable data repositories. Offering raw CSV or JSON files proves confidence in the analysis and invites external validation from academic researchers and industry analysts.
What Are the Core Benefits of Using Data Journalism in UK Research?
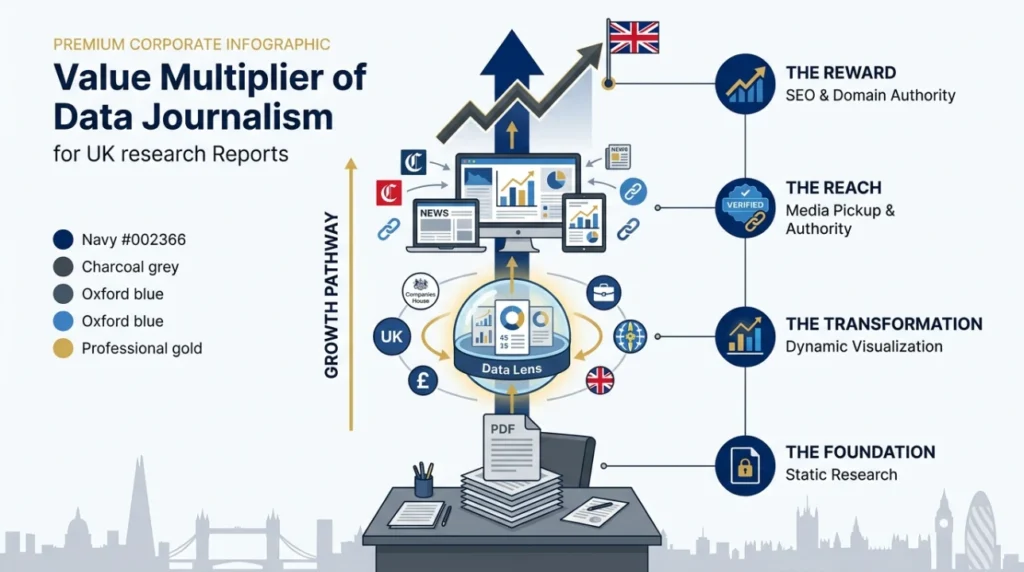
Data journalism increases reader engagement, drives media pickup, establishes domain authority, and enhances search engine visibility for UK research reports. It turns static PDF whitepapers into dynamic, citation-ready factual resources that secure high-value editorial backlinks.
Institutional Authority and Trust
Publishing original datasets positions an organization as a primary source of truth. Industry analysts, policy experts, and journalists search continuously for verified quantitative data. Reports built on data journalism principles become definitive reference materials for entire sectors.
When third-party publications cite a research report’s unique metrics, the original author gains immediate domain authority. This citation network establishes lasting industry credibility.
Media Coverage and Press Pickup
Newsrooms prioritize reports that offer pre-verified, visual data assets. UK news organizations maintain limited editorial bandwidth. A research paper accompanied by clean datasets, pre-formatted charts, and concise statistical summaries reduces editorial workload.
Journalists cover stories that provide clear, objective facts. By using data journalism frameworks, research reports provide press-ready material that editors publish without extensive secondary verification. Organizations targeting wider distribution often study how data journalism turns reports into UK news stories to align their output with newsroom needs.
Organic Search and AI Discovery
Search engines and AI discovery tools favor structured, fact-dense content. Data-rich documents rank higher for competitive research queries because they directly answer specific user questions.
Structured tables, clear definition headers, and concise data summaries match the exact indexing requirements of modern search algorithms and automated citation engines.
Where Is Data Journalism Applied Across UK Industries?
Data journalism is applied across UK financial services, healthcare analytics, real estate intelligence, public policy planning, and technology research. These sectors rely on structured data reports to evaluate market risks, track public health outcomes, and audit infrastructure investments.
Financial Services and Economics
UK financial institutions publish economic outlooks, market volatility analyses, and consumer spending evaluations. Data journalism structures complex trading records, interest rate adjustments, and regulatory filings into visual market dashboards.
For example, reports analyzing London Stock Exchange performance use time-series visualizations to track capital movements across specific economic sectors during quarterly reporting cycles.
Public Policy and Healthcare
Government departments, think tanks, and healthcare trusts use data journalism to evaluate policy outcomes. The NHS generates massive operational datasets regarding patient wait times, treatment success rates, and regional staffing levels.
Research publications transform these raw administrative logs into clear policy reports. Visualizing hospital performance trends across different NHS trusts helps policymakers allocate medical resources efficiently.
Real Estate and Urban Planning
The UK property market generates vast transactional data through the HM Land Registry and local council planning portals. Data-driven real estate reports analyze average price per square meter, rental yield shifts, and planning permission approval rates.
Mapping software projects these spatial metrics onto interactive geographic visualizers. Readers explore historical price appreciation trends down to specific postcode districts, such as SW1 in London or M1 in Manchester.
Technology and Telecoms
Technology research relies on quantitative performance indicators. Infrastructure reports on 5G network expansion, fiber-optic broadband rollout speeds, and cybersecurity incident frequencies require statistical rigor. Organizations seeking commercial production often evaluate specialized data journalism reports by media intelligence groups to build enterprise-grade assets.
Visualizing speed test metrics across urban and rural UK zones highlights infrastructure deficits clearly, providing actionable data for government regulators and telecommunications executives.
How Will AI and Automation Impact Data Journalism in Research?
AI and automation will accelerate data extraction, automated statistical cleaning, and real-time visualization generation in UK research reporting. Natural language processing models will analyze multi-gigabyte datasets instantly, allowing researchers to focus on contextual analysis and verification.
Automated Data Pipelines
Future research workflows will feature fully automated data pipelines. Algorithms will monitor government databases, such as the UK Companies House registry, continuously. When new filings appear, automated systems will extract, clean, and update visual report components instantly.
This automated architecture enables live research documents that update dynamically as fresh data publishes.
Advanced Computational Verification
Machine learning tools will enhance fact-checking procedures. Algorithmic verification systems will audit research drafts against trusted statistical databases automatically, flagging mathematical inconsistencies or misquoted figures before publication.
While automation handles heavy data processing, human editorial oversight remains essential. Expert analysts are required to verify context, enforce ethical standards, and ensure narrative accuracy across all published research reports.
Data journalism represents the gold standard for UK research report creation. By combining structured data extraction, statistical rigor, clear visual presentation, and open methodology, organizations produce reports that establish domain authority, satisfy search engine requirements, and build lasting reader trust.