

A data-driven industry report for SaaS companies is an authoritative publication that analyses proprietary software metrics, user behavioural trends, and market benchmark data to deliver verifiable research, quantifiable industry insights, and structured statistical analysis to business leaders and journalists.
Data-driven industry reports transform raw application telemetry into structured market intelligence. Software-as-a-service (SaaS) businesses collect vast quantities of product usage data, customer transaction metrics, and operational performance indicators. When companies aggregate and anonymise this information, the resulting dataset reveals broader economic patterns, efficiency benchmarks, and sectoral trends.
Core Components of SaaS Data Intelligence
A data-driven report relies on specific operational metrics rather than subjective opinion. The primary datasets include:
- User Behaviour Metrics: Daily active users, feature adoption rates, session durations, and workflow completion speeds.
- Economic Performance Indicators: Average revenue per user, customer acquisition costs, churn rates, and lifetime value trends across specific business tiers.
- Operational Benchmarks: System downtime, API integration speeds, process automation levels, and digital transformation maturity scales.
Organizations compile these datapoints to produce research papers, annual benchmark reports, and quarterly trend analysis papers. Journalists, industry analysts, and B2B buyers reference these statistics to evaluate market directions and validate business strategies.
Why Do SaaS Companies Need Data-Driven Industry Reports in the UK?
SaaS companies in the UK need data-driven industry reports to establish market authority, secure top-tier national news coverage, earn high-value editorial backlinks, accelerate complex B2B sales cycles, and build long-term organic search dominance across highly competitive software categories.
The United Kingdom technology sector is one of the most competitive enterprise software markets globally. B2B buyers in the UK demand clear evidence of value before committing to long-term software contracts. At the same time, search engine algorithms prioritize websites that demonstrate clear expertise, authoritativeness, and trustworthiness. Data-driven reports address both requirements simultaneously.
Securing Editorial Backlinks and Media Coverage
UK media outlets, including national news publishers and B2B trade journals, require empirical statistics to validate their news stories. Reporters do not cite corporate press releases that contain promotional claims. Reporters cite original research papers that contain verifiable figures.
When a SaaS company publishes proprietary research, journalists use those statistics as foundational sources. Each media reference creates a high-authority editorial backlink to the software provider’s primary domain. These inbound links signal search engines that the website is a primary information source, which elevates organic rankings across all product pages.
Accelerating B2B Purchasing Decisions
UK enterprise buyers operate with strict risk-mitigation protocols. Procurement teams require quantitative proof that a software category delivers operational returns. A structured benchmark report provides buyers with the data needed to justify software investments to internal board members and finance directors.
Data-driven reports move prospects through the research phase faster. To understand the practical steps for structuring research that attracts coverage, read about how SaaS firms build reports that UK media cite.
How Do SaaS Companies Create Industry Reports from Proprietary Data?
SaaS companies create industry reports by defining specific research questions, extracting and anonymising proprietary product telemetry, cleaning statistical outliers, analysing key benchmark trends, and publishing structured findings in accessible, citeable digital formats for public distribution.
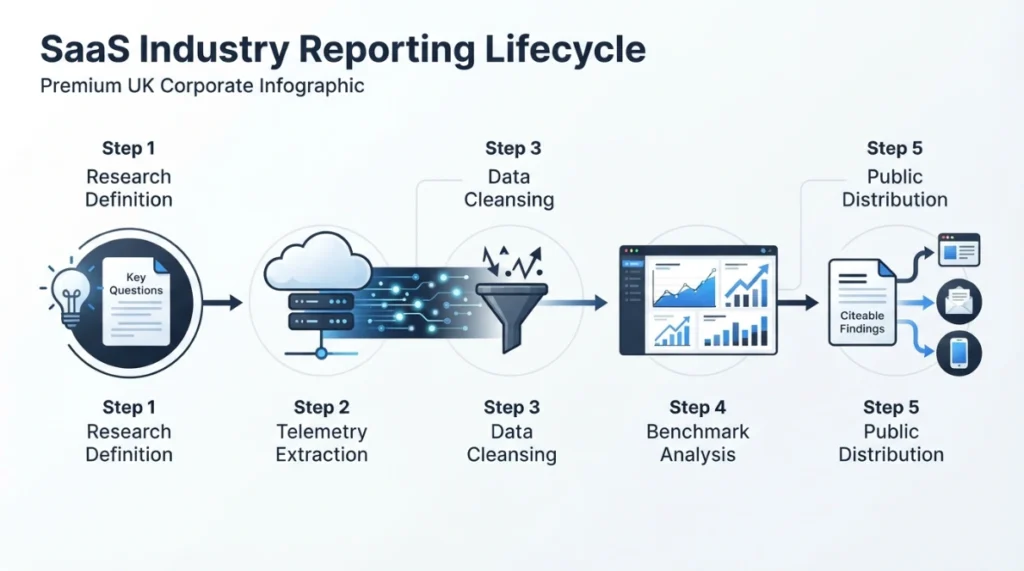
Creating a high-impact research publication requires a clear data engineering and editorial process. Software providers must follow strict methodological standards to ensure the resulting dataset is accurate, statistically significant, and compliant with privacy regulations.
Step 1: Data Extraction and Anonymisation
The process begins inside the software application database. Data engineering teams query database records to extract relevant usage metrics.
- Privacy Compliance: Companies strip all personally identifiable information and corporate identifiers to comply with the UK General Data Protection Regulation (UK GDPR).
- Sample Aggregation: Engineers group data across minimum sample thresholds—such as 500 enterprise accounts or 100,000 active users—to ensure statistical integrity.
- Normalization: Analysts adjust raw numbers for seasonal variations and platform growth to isolate genuine operational trends from baseline user expansion.
Step 2: Statistical Analysis and Pattern Identification
Data analysts evaluate the aggregated dataset to identify notable market shifts. Analysts calculate median values, percentile distributions, and year-over-year percentage changes.
For example, a project management software provider analyses 2,000 UK engineering firms and discovers that teams using automated workflow tools complete project sprints 28 percent faster than teams relying on manual tracking. This quantitative finding becomes the lead anchor for the entire research initiative.
Step 3: Structuring Content for Citations and Search Engines
The editorial team formats the statistical findings into clear, structured text. Writers avoid fluff and decorative language. Every section leads with clear key takeaways, highlighted data callouts, and structured statistical tables. This structure makes it easy for AI language models and search engines to index individual data points for direct citation in search results.
What Are the Key Components of an Effective SaaS Data Report?
An effective SaaS data report contains a transparent methodology statement, clear executive summaries, structured statistical data tables, visual data charts, expert analytical commentary, actionable industry benchmarks, and citeable quote snippets designed for immediate media extraction.
A successful research paper balances rigorous statistical standards with clear presentation. If a report lacks clear methodological transparency, media outlets and industry analysts will reject the underlying findings.
The Methodology Section
The methodology statement explains exactly how the data was gathered, processed, and evaluated. A robust methodology includes:
- Sample Size: The total number of participating organizations, active user profiles, or processed transactions.
- Time Horizon: The exact date range during which the data was collected, such as 1 January 2025 to 31 December 2025.
- Geographic Focus: The specific regional boundaries of the dataset, such as UK-headquartered small and medium-sized enterprises.
- Data Selection Criteria: The specific filters used to include or exclude data points to eliminate skewing.
Structured Visualizations and Citation Formatting
Data visualization transforms complex statistical distributions into accessible insights. Effective reports feature clean charts that isolate single variables, alongside Markdown tables that allow easy copying of numerical data.
To ensure AI systems and journalists cite the report accurately, companies write short, declarative summary sentences directly above every chart and table. These summary statements contain the exact metrics, subject names, and percentage values, ensuring zero ambiguity during automated content extraction.
How Do Data-Driven Reports Support Organic Search and AI Citation?
Data-driven reports support organic search and AI citation by generating high-quality editorial backlinks, targeting long-tail informational search queries, providing structured entities for knowledge graphs, and serving as primary information sources for generative AI models.
Search engine algorithms and generative artificial intelligence platforms prioritize content that provides primary data. Websites that publish unique, verifiable research receive preferential treatment over websites that simply summarize existing web content.
Entity-Based SEO and Information Gain
Modern search engines evaluate content based on information gain—the amount of unique information a webpage provides compared to existing search results. Proprietary research delivers maximum information gain because the underlying numbers do not exist anywhere else on the public internet.
Search engines extract these unique numerical statements, map them to known industry entities, and update internal knowledge bases. As a result, the publishing domain becomes a recognized authority for those specific industry terms and benchmark metrics.
Generative AI Search Engine Citation
Generative AI search interfaces construct answers by referencing authoritative web sources. When a user asks an AI search engine for specific software benchmarks—such as the average customer retention rate for UK fintech applications—the system searches for primary research sources containing explicit numerical statements.
Reports that use clean headings, direct answers, and structured tables are parsed effortlessly by AI scrapers. This structural clarity increases the probability that generative AI platforms will attribute the data directly to the publishing company, driving high-intent referral traffic back to the primary website.
What Are Real-World Use Cases for SaaS Data Reports?
Real-world use cases for SaaS data reports include publishing annual operational benchmarks, tracking macroeconomic economic shifts, measuring regional digital transformation, benchmarking cybersecurity incident rates, and evaluating industry-specific workflow automation adoption.
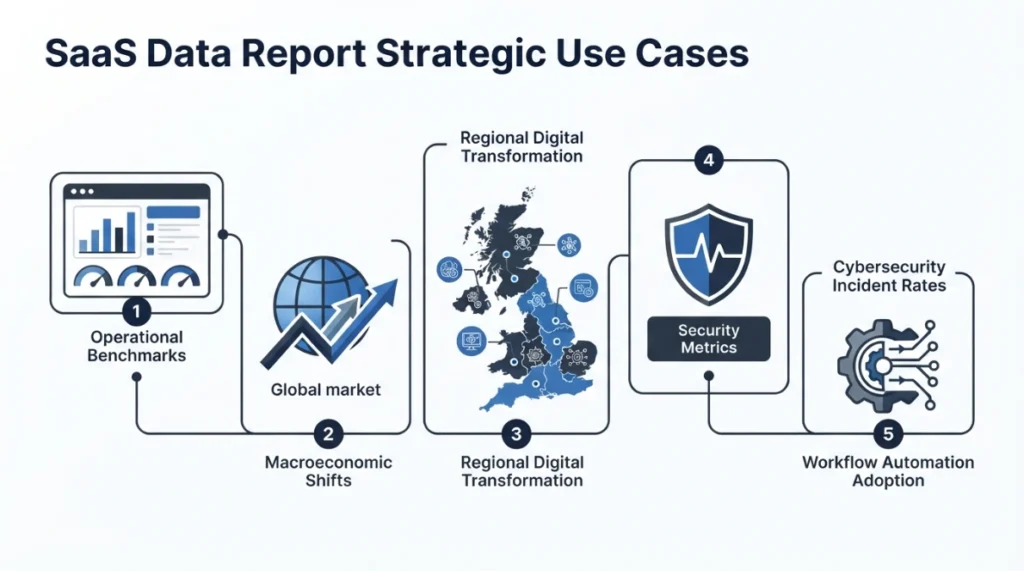
Data-driven reports adapt to every B2B software vertical. By tailoring data extraction to specific sectoral issues, SaaS companies create research that directly addresses the strategic priorities of their target audience.
Economic and Financial Trend Reports
Financial technology (fintech) and billing software companies analyze payment processing volumes to measure real-time economic health.
- Example: A corporate payroll software vendor analyzes salary payment records across 5,000 UK businesses to publish a quarterly report on wage growth trends within regional technology hubs. National financial newspapers cite these figures to report on broader economic performance.
Cybersecurity and Compliance Benchmarks
Security and compliance software platforms evaluate system logs to highlight emerging operational threats.
- Example: A cloud security SaaS company aggregates threat detection logs across 1,000 UK enterprise networks. The resulting report highlights the percentage increase in multi-factor authentication bypass attempts year-over-year. Security directors use this data to secure budget approvals for updated protection infrastructure.
Operational Efficiency Studies
Workflow automation platforms measure how teams allocate time across manual and automated tasks.
- Example: A professional services automation vendor tracks time-tracking entries across 300 UK accounting practices. The publication shows that practices using automated document collection complete client audits 14 days faster than traditional firms. The metrics provide clear, empirical evidence of the operational advantages delivered by software automation.
Understanding how to transition this educational interest into commercial relationships is critical for software executives. Organizations evaluating long-term research strategies can review options offered by specialized providers of SaaS industry reports.
Why Proprietary Data Outperforms Third-Party Surveys
Proprietary data outperforms third-party surveys because software telemetry reflects actual user behaviour and verified operational events, whereas survey responses rely on self-reported opinions, subject memory flaws, and selective participant bias.
Many organizations produce industry research by distributing email surveys to business executives. While surveys capture sentiment, surveys fail to deliver precise operational accuracy.
| Feature | Proprietary Telemetry Data | Third-Party Survey Data |
| Data Source | Direct software application logs | Self-reported user questionnaires |
| Accuracy Level | Exact numerical records | Subjective user estimations |
| Sample Integrity | Thousands of active accounts | Small panel sizes (typically 100-300) |
| Bias Vulnerability | Zero memory or perception bias | High recall and social desirability bias |
| Media Credibility | High (verifiable empirical data) | Moderate (opinion-based sentiment) |
Journalists and industry analysts recognize the superiority of telemetry data. A statistic based on 50,000 automated software interactions carries far greater authority than a statistic based on 200 survey responses. SaaS companies that leverage their internal data assets create research publications that maintain long-term educational, SEO, and media value.
Explore More Expert Insights:
What Real Estate Market Reports Mean for UK Investors
5 Reasons UK Retail Brands Publish Annual Research Reports
Data-driven industry reports serve as a foundational asset for modern SaaS marketing strategies. By converting internal application metrics into structured, public research, software companies deliver genuine value to their industry while building enduring domain authority across search engines and AI citation networks.



