

A real estate market report is a structured, data-driven document that analyses property prices, rental yields, transactional volumes, and macroeconomic trends within a specific geographic boundary. It provides factual metrics to help investors evaluate capital growth potential, regional supply dynamics, and rental demand.
Real estate market reports aggregate raw transaction data from official repositories, mortgage lenders, and property portals. In the United Kingdom, these documents translate complex economic activity into actionable intelligence for individual and institutional property buyers.
A standard report covers specific timeframes, such as monthly performance metrics, quarterly yield updates, or annual economic forecasts. Market reports remove emotional bias from capital allocation decisions by using verified historic performance and statutory registry filings.
Essential core entities in market data
Every real estate market report relies on verified metrics compiled by governmental and financial organisations. Understanding these primary figures ensures accurate data interpretation:
- HM Land Registry (HMLR) Data: The definitive source for actual completed sales prices across England and Wales. Unlike estate agent asking prices, HM Land Registry records the exact statutory figure paid at legal completion.
- UK House Price Index (UK HPI): Calculated by the Office for National Statistics (ONS), the UK HPI uses single-property attributes and actual sale values to calculate non-biased price movements across regions.
- Mortgage Approval Volumes: Published monthly by the Bank of England, this figure acts as a leading indicator of buyer demand and future transaction completions.
- Gross and Net Rental Yields: The annual rental income expressed as a percentage of the total property purchase cost. Net yields account for operational expenses such as ground rent, service charges, and letting fees.
How does the compilation process turn raw property transaction data into actionable intelligence?
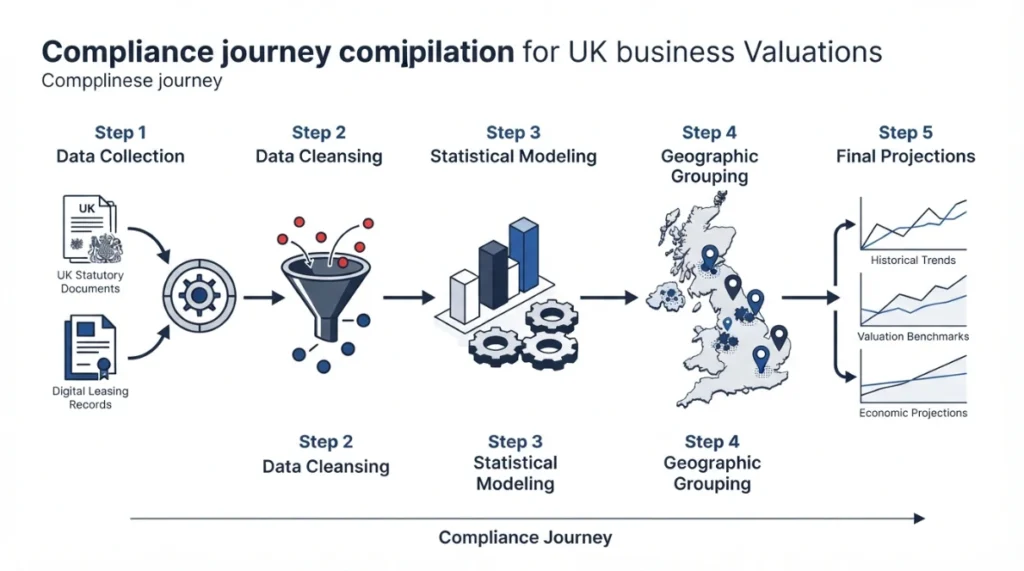
The compilation process collects raw sales and leasing records from statutory sources, cleans the data to remove outliers, and applies statistical modeling. Data scientists then group the information geographically to generate historical trends, current valuation benchmarks, and forward-looking economic projections.
1. Data Collection and Aggregation
The process begins with automated data collection from primary databases. These sources include HM Land Registry, Registers of Scotland, Land and Property Services Northern Ireland, the Bank of England, and the Office for National Statistics. The system imports total sales prices, property types (detached, semi-detached, terraced, or flat), buyer funding types (mortgage or cash), and localized tenancy rates.
2. Data Cleaning and Outlier Removal
Raw property records contain anomalies that can distort average values. Data processors filter out non-market transactions, such as property transfers between family members, discounted right-to-buy sales, and bulk corporate re-structuring transactions. Properties sold significantly above or below standard market rates undergo verification to preserve database integrity.
3. Statistical Analysis and Standardisation
To account for differences in property size, age, and location, reports apply statistical techniques such as hedonic regression. This method isolates specific features—such as bedroom count, square footage, or proximity to transit links—ensuring that index changes reflect actual market value shifts rather than changes in the mix of properties sold during a specific month.
4. Categorisation and Delivery
The final step categorises the statistical outputs into accessible geographic and sector-based formats. Analysts create localized sub-market breakdowns, mapping specific postal sectors alongside broader regional comparisons to highlight emerging geographic trends.
What core components make up a professional real estate market report?
A professional real estate market report includes property price indices, total transaction volumes, rental yield percentages, housing supply metrics, and local economic context. Combining these components gives investors a complete view of current property risk, local tenant demand, and long-term capital preservation.
| Component Category | Key Indicators Measured | Strategic Value for Investors |
| Capital Valuations | Average Price, Annual Growth %, Price per Sq Ft | Establishes entry baseline and historical capital appreciation. |
| Rental Performance | Median Rent (£ pcm), Rental Growth %, Average Void Days | Calculates immediate cash flow efficiency and ongoing income coverage. |
| Market Liquidity | Transaction Volumes, Days on Market, Fall-Through Rates | Measures sales velocity and ease of capital exit. |
| Supply Pipeline | Planning Applications, Construction Starts, Completed Units | Identifies future localized inventory saturation or stock shortages. |
Housing market price indices
Price indices track price adjustments over annual, quarterly, and monthly timeframes. For instance, official statistics show the average UK property value reached £272,000, representing an annual growth rate of 2.0%. Reports track these figures alongside regional performance gaps, such as the North West experiencing a 4.7% annual price rise while London experienced a 2.5% decrease.
Rental yields and tenant demand metrics
Rental indicators show the cash flow viability of buy-to-let properties. Data points detail current average monthly private rents, such as the UK average of £1,393 per month. Reports track localized yield variations across property types—for example, comparing terraced houses yielding 6.5% against city-centre flats yielding 4.8%—to highlight income opportunities.
Inventory, planning, and supply volume
Supply metrics track current construction starts and completions alongside existing listing stock. Data showing 33,960 house building starts in England over a single quarter provides direct visibility into future housing supply. High construction volumes signal prospective supply growth, which can limit short-term capital appreciation in specific postcode sectors.
How do market reports benefit UK property investors when making capital allocation decisions?
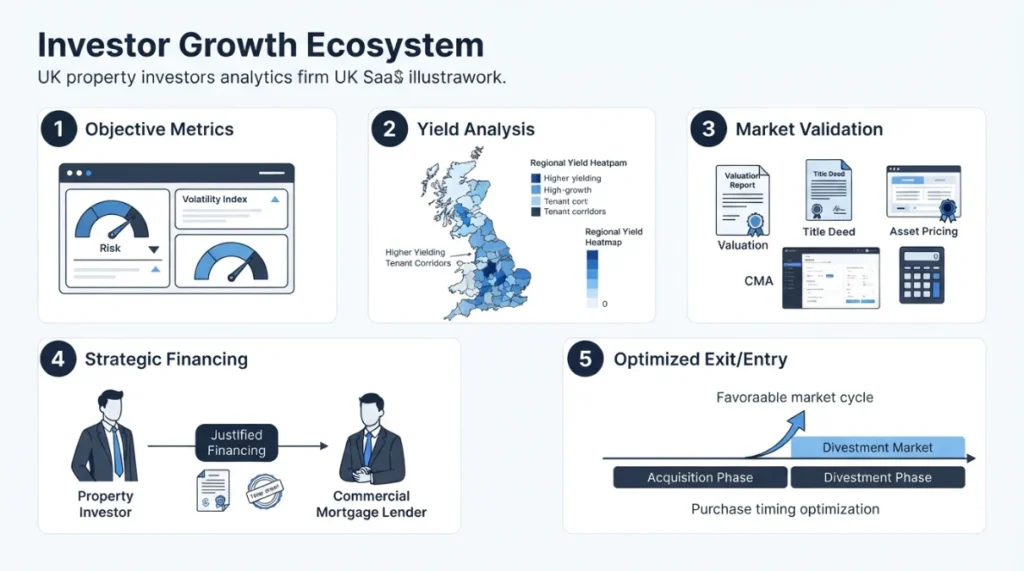
Market reports benefit UK property investors by providing objective metrics that reduce investment risk, highlight higher-yielding regions, and optimize purchase timing. Investors use these factual insights to validate asset pricing, identify high-growth tenant corridors, and justify financing requests to commercial mortgage lenders.
Fact-based asset valuation
Property buyers use transactional reports to verify if an asking price aligns with completed sales in the same postcode. Comparing seller asking prices against Land Registry completion figures prevents overpaying during market surges.
Identification of regional growth corridors
National averages often conceal localized performance shifts. Detailed reports highlight regional variations, enabling investors to shift capital away from stagnant or declining markets and toward areas showing strong wage growth, infrastructure spending, and rising tenant demand.
Risk mitigation and stress testing
Market reports outline transactional fall-through rates, price reduction percentages, and average days required to secure a buyer. Accessing these figures allows investors to stress-test their portfolios against rising interest rates, longer void periods, or shifting market conditions.
What are the primary investment scenarios for applying real estate report insights?
The primary investment scenarios for real estate reports include buy-to-let portfolio expansion, commercial-to-residential conversions, property flipping, and institutional land acquisitions. Each strategy relies on specific data points within a report to optimize risk management and financial returns.
Scenario 1: Residential buy-to-let portfolio expansion
A private investor expanding a buy-to-let portfolio uses rental reports to identify postcodes with low vacancy rates and strong rental growth. Reviewing average rents (£1,808 pcm) alongside localized tenant demand data helps the investor select properties that generate positive cash flow and satisfy mortgage coverage tests.
For further insight into how reports target specific buyer profiles, review the guide on [investment report audience distribution].
Scenario 2: Fix-and-flip residential trading
An investor buying distressed homes for quick resale relies heavily on average price per square foot data and inventory figures. If local report data shows 14.3% of listed properties accepting price reductions, the investor can negotiate lower initial purchase prices to protect profit margins upon resale.
Scenario 3: Institutional land development and build-to-rent
Institutional investors acquiring land for new developments analyze housing completion statistics alongside local economic data. Reviewing quarterly construction starts ensures developers avoid building in localized markets facing an oversupply of new units.
To see specialized examples of market analysis frameworks, explore [specialised property research tools].
How can investors distinguish high-quality real estate reports from unreliable sources?
Investors distinguish high-quality market reports by looking for verified statutory data sources, clear analytical methodologies, regular publishing schedules, and transparent reporting. Superior reports rely on verified completed sales records rather than unverified listing prices or subjective opinions.
Verified primary data sources
Reliable reports explicitly cite primary information suppliers, including HM Land Registry, the Office for National Statistics, the Bank of England, and the Royal Institution of Chartered Surveyors (RICS). Avoid reports that rely entirely on proprietary internal estimate algorithms without disclosing underlying sample sizes.
Methodological transparency
Quality research papers clearly explain how they calculate key metrics. Reliable publishers outline whether figures use mean or median averages, how they adjust for seasonal fluctuations, and the exact mathematical models used to account for property variations.
Timeliness and consistency
Property markets change as interest rates, tax laws, and economic conditions evolve. Dependable publishers release updates on fixed monthly or quarterly schedules, allowing investors to track long-term performance trends accurately.
Explore More Expert Insights:
How Cloud Kitchens Boost Demand Using Display Campaigns
How Food Businesses Improve Visibility Using Banner Ads
What key summary insights should investors retain regarding United Kingdom real estate market reports?
Real estate market reports give UK property investors the objective data needed to make informed financial decisions. By compiling statutory transaction records, local tenancy rates, and regional supply pipeline indicators, these documents offer a clear view of market health across national and local markets.
Using market reports shifts real estate investing from guesswork to systematic analysis. Investors who regularly review verified performance metrics can manage risk effectively, optimize capital deployment, and maintain sustainable long-term returns across varying economic cycles.



