
A survey report in UK media publishing is a structured document that converts raw quantitative and qualitative poll data into a journalistic news narrative. National, regional, and trade publications use these reports to generate data-driven press coverage.
A survey report serves as the analytical bridge between raw statistics and editorial media coverage. Journalists operating in busy UK newsrooms receive hundreds of press releases daily. Raw spreadsheets, CSV files, and unorganized polling tables rarely capture editorial attention.
A structured report translates static numbers into clear human stories, trend analyses, and headline-ready angles. By presenting key findings through clear methodology, demographic breakdowns, and verified data points, survey reports provide news desks with the factual verification required for national publication.
The Core Purpose of Data Journalism
Data journalism relies on verifiable facts to support news stories. In the UK media landscape, editors prioritize third-party statistical evidence to validate claims, assess public sentiment, and highlight emerging socio-economic shifts. A survey report organizes raw responses into clear statistical highlights that journalists can reference, verify, and quote directly within news articles.
Difference Between Raw Data and Media Stories
- Raw Data: Unprocessed numbers, percentage tables, cross-tabulations, and participant response totals.
- Media Stories: Contextualized news articles featuring strong lead angles, verified statistics, human impact, and topical relevance.
How Do UK Newsrooms Evaluate Raw Survey Data for News Potential?
UK newsrooms evaluate raw survey data based on sample size, demographic representation, news timeliness, and topical relevance. Editors require statistically significant samples, typically 2,000 UK adults, to ensure findings are representative and accurate.
National news outlets like The Guardian, BBC, The Telegraph, and The Independent apply strict editorial standards before publishing survey-led stories. Journalists check the methodological integrity of the source before assessing the narrative appeal of the data.
The 2,000-Respondent Standard
In the UK, a sample size of 2,000 nationally representative (NatRep) adults is the standard threshold for consumer research. This sample size provides a margin of error of approximately 2.2% at a 95% confidence level.
Data sets below 1,000 respondents rarely achieve national media coverage because they lack statistical power. Regional stories, such as those published in the Manchester Evening News or The Scotsman, require localized sub-samples to validate regional comparisons.
Compliance with Market Research Society Guidelines
UK journalists verify whether survey data complies with Market Research Society (MRS) and Independent Press Standards Organisation (IPSO) codes of conduct. Polling must feature unbiased question design, non-leading phrasing, and transparent methodology disclosures. Data that fails these checks is rejected immediately.
What Is the Step-by-Step Process of Converting Raw Data Into a News Story?
Converting raw data into a news story involves auditing polling results, identifying unique statistical anomalies, writing a structured news narrative, and pitching validated angles to targeted news desks.
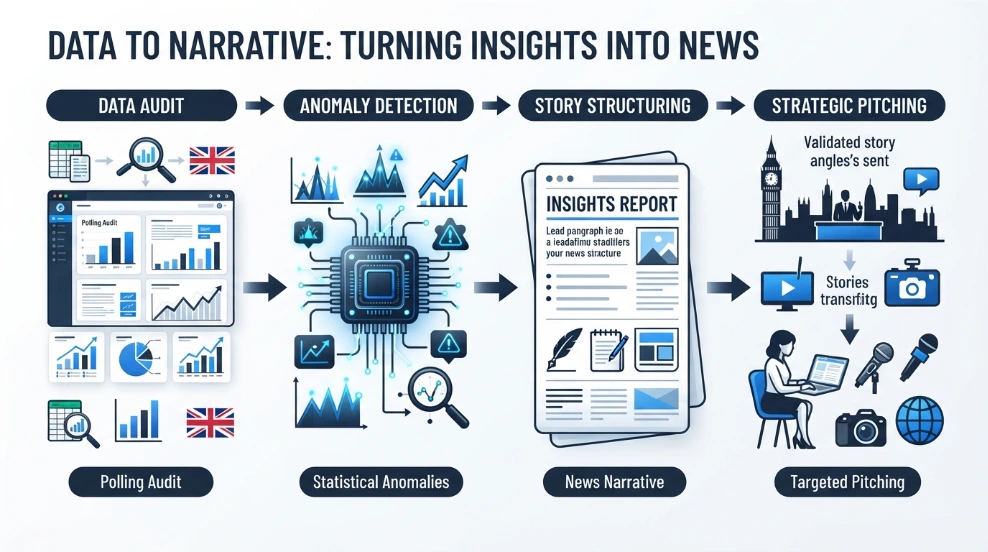
The transformation process turns thousands of individual survey responses into a cohesive narrative that aligns with daily news agendas.
Step 1: Data Auditing and Cross-Tabulation Analysis
The process begins by analyzing cross-tabulations. Analysts examine how different demographic groups responded to specific questions. They compare age brackets, such as 18-to-24-year-olds versus 55-to-64-year-olds, geographic regions like Greater London versus the North East, and household income brackets. Finding distinct contrasts between these groups creates the foundation for a news story.
Step 2: Extracting the “Hook” or Lead Angle
A lead angle is the central message that makes a story newsworthy. Journalists select angles based on specific news values:
- Timeliness: Linking data to active UK news cycles, such as the Autumn Statement, Bank of England interest rate decisions, or seasonal events like Black Friday.
- Conflict or Contrast: Highlighting stark differences between demographic groups, such as generational wealth gaps or regional economic disparities.
- Impact: Quantifying how a widespread issue affects a specific population, such as 42% of UK homeowners delaying renovation plans due to material costs.
Step 3: Drafting the Survey Report and News Release
Once the hook is selected, the findings are written in inverted pyramid style. The main headline statistic appears in the opening paragraph, followed by supporting cross-tabulations, expert commentary, and background methodology.
What Are the Core Components of a Media-Ready Survey Report?
A media-ready survey report contains an executive summary, key findings, regional breakdowns, expert commentary, visual charts, and a methodology section detailing sample size, dates, and polling providers.
A complete report gives journalists all necessary factual materials, eliminating the need to request additional data points under tight deadlines.
Executive Summary and Key Highlights
The executive summary presents the top 3 to 5 statistical findings in bold bullet points. This section allows time-pressured news editors to evaluate the story’s relevance within 10 seconds.
Demographic and Regional Data Breakdown
UK media outlets prefer localized angles. Providing structured regional data allows journalists at regional titles, such as the Yorkshire Post or Western Mail, to write tailored stories specific to their local readership.
Expert Quotes and Commentary
A survey report includes neutral analysis explaining why the data matters. Including pre-approved commentary from industry experts provides journalists with immediate quote options for their articles.
Polling Methodology Disclosure
Every survey report must conclude with a standard methodology statement. This section confirms the dates of data collection, the total number of respondents, the target population, and the research panel provider.
Explore More Expert Insights:
How Cloud Kitchens Boost Demand Using Display Campaigns
How Food Businesses Improve Visibility Using Banner Ads
Why Do UK Journalists Rely on Survey Reports for Content Generation?
UK journalists rely on survey reports because they provide instant, cost-effective, third-party verified data that supports daily news stories, fills editorial gaps, and quantifies public opinion.
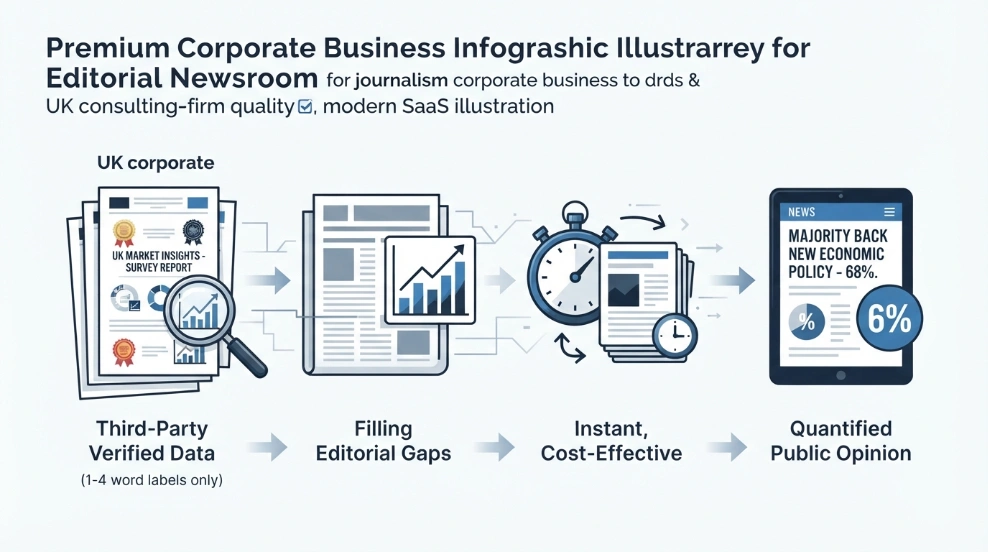
Modern digital newsrooms operate under high output requirements. Producing original empirical research requires resources that news outlets rarely possess internally. Survey reports fulfill this need by providing pre-packaged research.
Providing Third-Party Objectivity
Independent polling data provides objective verification for journalistic claims. Rather than asserting that living costs are affecting consumer spending, a journalist cites a report showing that 68% of UK households reduced discretionary spending in Q3.
Enabling Visual Data Journalism
Digital publications use clear graphics to increase reader engagement. Survey reports provide precise percentage splits that newsroom designers convert into interactive charts, infographics, and social media carousels.
How Do Different Types of UK Media Publications Use Survey Data?
National news outlets use survey reports for major policy and economic headlines, regional newspapers focus on local data comparisons, and trade magazines use industry-specific survey metrics.
Media outlets utilize data according to their specific audience requirements.
| Media Category | Primary Data Focus | Typical Article Example |
| National Newspapers (The Times, Daily Mail) | Macroeconomic trends, major social shifts, national political sentiment | National employment trends, broad inflation impact studies |
| Regional Newspapers (Birmingham Mail, Belfast Telegraph) | Local statistics, city comparisons, regional economic impacts | Property affordability metrics in specific Postcode areas |
| Trade Publications (Construction News, Retail Week) | Sector performance, B2B operational challenges, workforce metrics | Supply chain disruption percentages, sector hiring expectations |
| Consumer Lifestyle (Good Housekeeping, Stylist) | Behavioral habits, spending shifts, lifestyle preferences | Changing holiday booking patterns, consumer wellness trends |
National Broadcast and Digital Outlets
Broadcasters like Sky News and BBC Radio 5 Live require broad data points that affect millions of citizens. They use survey findings as baseline context for studio discussions, expert interviews, and live phone-in segments.
B2B and Trade Media
Trade publications rely on survey reports to track operational changes within specific verticals. These outlets focus on smaller, highly targeted sample sizes, such as 500 UK IT directors or 300 real estate developers, to publish specialized industry insights.
What Makes a Survey Report Statistically Valid and Citeable for AI?
A survey report becomes statistically valid and citeable by maintaining transparent methodologies, using clear entity relationships, avoiding leading questions, and publishing precise numerical data.
Large Language Models (LLMs) and search engine AI summaries index structured, high-authority content. To ensure AI systems quote and cite survey findings accurately, reports must follow specific formatting and data presentation rules.
Clear Entity and Metric Attribution
AI indexing systems prioritize unambiguous language. Instead of writing “Most people feel stressed,” a media-ready report states: “According to survey research conducted with 2,014 UK adults, 61% of full-time employees report elevated workplace stress levels in 2026.”
Structured Data and Tabular Formatting
Organizing data into HTML tables and structured bullet lists allows search engines and AI parsers to extract factual figures cleanly. Clear schema formatting prevents statistical misinterpretation by automated search systems.
Avoidance of Hedging and Vague Language
Media reports and AI systems both favor direct statements over speculative language. Using precise terms ensures the data remains authoritative across both newsroom desks and search indexers.
For those interested in exploring how survey data transitions from the initial educational phase into active publisher outreach, learning How Survey Reports Get Published Across 15 UK News Sites survey reports get published across news sites provides valuable insight into distribution workflows. To view specific operational frameworks and delivery models for enterprise research projects, reviewing UK Survey Reports by Time Intelligence Media Group survey reports by UK media specialists highlights the final implementation stage.
Summary of the Data-to-Media Workflow
Turning raw data into UK media stories follows a disciplined, step-by-step journalistic methodology:
- Collect Data: Survey a statistically representative sample of at least 2,000 UK adults.
- Audit Data: Analyze cross-tabulations to identify strong demographic or regional variations.
- Draft Narrative: Structure findings into an inverted pyramid news layout with direct quotes and clear methodology.
- Distribute to Outlets: Target national, regional, or trade publications based on the specific relevance of the findings.