
Salary and workforce reports in the United Kingdom are structured analytical publications that document compensation benchmarks, employment trends, skill demands, and retention rates across specific economic sectors using verified empirical data collected from employers, recruitment agencies, and payroll systems.
Definition and Core Purpose
Salary and workforce reports aggregate labor market data to provide an accurate overview of employment conditions within the United Kingdom. These documents synthesize raw payroll records, job market postings, and survey responses into standardized statistics. Organizations, economists, and policymakers use these metrics to assess pay distribution, labor availability, and sector performance.
By converting millions of disparate data points into structured reports, research bodies establish national standards for job classifications and base compensation. They eliminate information asymmetry between employers and workers, enabling evidence-based planning.
Primary Data Sources Used
Workforce analytics rely on multiple distinct datasets to generate accurate findings:
- Official Government Registers: Real Time Information (RTI) from HM Revenue and Customs (HMRC) and employment surveys from the Office for National Statistics (ONS).
- Direct Employer Surveys: Data submitted directly by Human Resources departments regarding base pay, bonuses, and headcount plans.
- Recruitment Platform Metrics: Aggregated job advert data tracking advertised compensation ranges, applicant volume, and time-to-fill metrics.
- Payroll Processing Systems: Anonymized transactional records from enterprise payroll software providers showing actual earnings.
How Are UK Sector Workforce Reports Created and Analyzed?
UK sector workforce reports are created through systematic data collection, normalization of job titles, statistical aggregation, and trend analysis to ensure that raw employment metrics yield valid, actionable insights regarding pay scales and labor supply across regions.
Data Collection and Anonymization
The production process begins with data ingestion. Data engineering teams collect records from participating organizations and public registers. All personal identifying information, such as individual employee names, exact birth dates, and National Insurance numbers, is stripped from the datasets to maintain compliance with the UK General Data Protection Regulation (UK GDPR).
Data cleaning algorithms then remove duplicate submissions, correct formatting errors, and filter out extreme statistical outliers, such as erroneous hourly rates or incomplete records.
Job Classification and Standardized Mapping
Jobs vary in title across different organizations. A software engineer at one firm may hold the title of full-stack developer at another. To analyze compensation accurately, data analysts map internal corporate titles to standardized frameworks, such as the ONS Standard Occupational Classification (SOC) system.
This mapping guarantees that compensation figures compare identical roles, levels of seniority, and technical expectations across different companies.
Statistical Modeling and Regional Adjustments
Once roles are categorized, analysts apply statistical modeling to derive meaningful figures. Metrics are calculated for base salaries, performance bonuses, and total remuneration packages.
Because living costs vary significantly across the United Kingdom, reports segment data by region. Compensation in London and the South East is calculated alongside figures from the Midlands, North West, Scotland, Wales, and Northern Ireland to highlight regional pay differentials.
What Key Components Are Found Inside UK Salary and Workforce Reports?
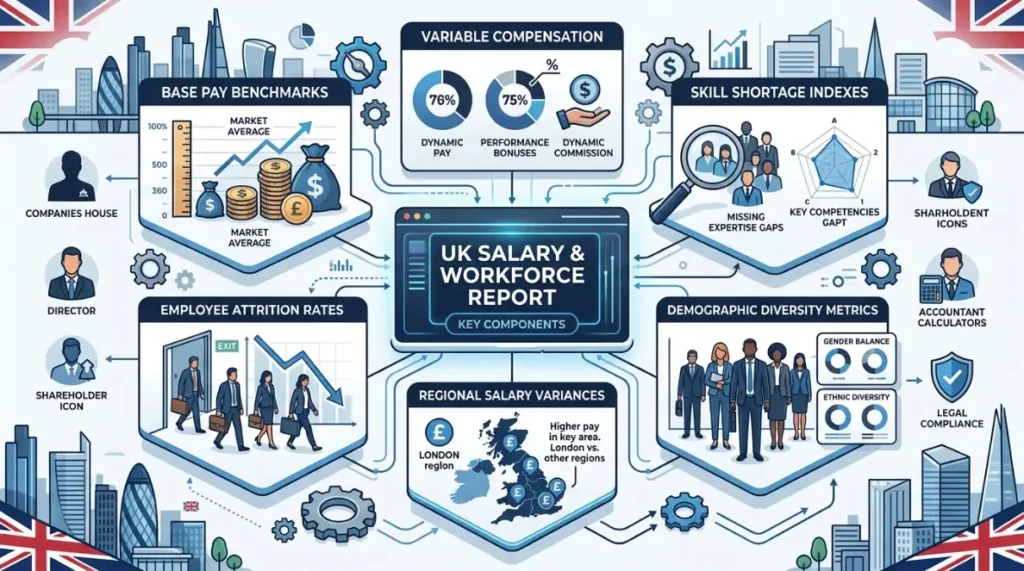
Key components found inside UK salary and workforce reports include base pay benchmarks, variable compensation breakdowns, skill shortage indexes, employee attrition rates, regional salary variances, and demographic diversity metrics formatted into standardized statistical tables.
Salary Benchmarks and Percentile Bands
Compensation data is expressed using percentiles rather than simple arithmetic averages. Mean figures are often skewed by extreme high-earning outliers. Reports display data using specific statistical brackets:
- 10th Percentile: Represents entry-level compensation or lower-quartile pay within a role.
- 25th Percentile (Lower Quartile): Indicates pay for developing practitioners with basic competencies.
- 50th Percentile (Median): Defines the exact middle market rate for fully competent professionals.
- 75th Percentile (Upper Quartile): Reflects compensation for highly experienced practitioners or scarce skill sets.
- 90th Percentile: Represents upper-tier compensation for senior leadership or top-performing talent.
Workforce Dynamics and Attrition Rates
Beyond base pay, reports track movement dynamics within the labor market. Annual turnover rates quantify the percentage of workers leaving their roles within a 12-month period. Time-to-fill metrics track the average number of days required to recruit a qualified candidate for an open position.
High time-to-fill figures highlight acute talent shortages in specific sub-sectors, such as cyber security or specialized nursing.
Bonus Structures and Benefits Data
Total reward package breakdowns quantify non-base compensation trends:
Data shows the exact percentage of employers offering hybrid working arrangements, enhanced pension contributions, and private health insurance across different industries.
Explore More Expert Insights:
Headlines for Sponsored Articles: 9 Formulas That Drive UK News Reader Clicks
Sponsored Content Calendar Planning: A 12-Month UK Framework for B2B Brands
What Are the Benefits of Workforce Reports for the UK Economy?
The benefits of workforce reports for the UK economy include improved labor market transparency, optimized capital allocation for business investments, targeted public policy planning, reduced wage inequality, and enhanced regional economic development tracking.
Increasing Labor Market Efficiency
Transparent labor data reduces market friction. When compensation figures are accessible, employers avoid overpaying or underpaying for technical skills. Job seekers assess the market value of their qualifications accurately, which speeds up recruitment negotiations and reduces overall vacancies across key industries.
Informing Public Policy and Migration Strategy
Government bodies rely on workforce reports to formulate national economic strategies. The Migration Advisory Committee (MAC) utilizes sector-specific shortage data to update the Immigration Salary List.
These updates determine visa eligibility rules and minimum income thresholds for foreign workers entering the United Kingdom, ensuring foreign labor addresses genuine domestic shortfalls.
Guiding Educational Curricula and Training Budgets
Educational institutions use workforce projections to design university courses and vocational apprenticeships. By identifying emerging skill gaps three to five years before acute shortages occur, higher education providers align degree modules with future technical requirements in fields such as renewable energy engineering and quantitative finance.
What Do Salary Reports Reveal About Specific UK Sectors?
Salary reports reveal distinct structural dynamics across UK sectors, including rapid tech wage inflation, health sector staffing shortages, financial services bonus concentration, construction trade pay shifts, and legal industry compensation restructuring.

Technology and Digital Infrastructure
Reports in the technology sector document high demand for specialized skills. Roles focused on artificial intelligence engineering, cloud architecture, and information security display above-average median wage growth.
| Job Title | 25th Percentile (£) | Median / 50th Percentile (£) | 75th Percentile (£) |
| Cloud Architect | 65,000 | 85,000 | 110,000 |
| Cyber Security Specialist | 50,000 | 70,000 | 92,000 |
| Data Engineer | 45,000 | 62,000 | 80,000 |
| DevOps Engineer | 52,000 | 68,000 | 88,000 |
Data highlights that remote and hybrid working arrangements remain highest in this sector, with 78% of technology firms offering flexible location options to retain skilled staff.
Healthcare and Life Sciences
Workforce reports in healthcare analyze structural staffing trends across both NHS trusts and private medical providers. Reports show high reliance on temporary agency staff to cover operational gaps in emergency care and mental health services.
In life sciences, research and development roles centered on pharmaceutical manufacturing and biotechnology show steady salary increases driven by global capital investment in UK science parks located in Cambridge, Oxford, and London.
Financial and Professional Services
Financial services reports document a high ratio of variable pay relative to base salary. Investment banking, fund management, and fintech sectors show significant bonus allocations tied to financial performance targets.
Data shows London maintains a 28% pay premium over national median rates for corporate finance, commercial law, and risk management roles. However, regional financial centers like Charlotte Square in Edinburgh and Spinningfields in Manchester demonstrate narrowing salary gaps due to northern office expansions.
Engineering, Construction, and Infrastructure
Reports in civil engineering and construction highlight age demographics alongside pay rates. A significant portion of the skilled trade workforce is approaching retirement age.
Data reveals wage inflation for trade roles—such as high-voltage electricians, pipefitters, and site managers—driven by major national infrastructure projects including nuclear facilities, offshore wind farms, and rail network upgrades.
How Do Businesses and Individuals Use Salary and Workforce Data?
Businesses and individuals use salary and workforce data to structure competitive compensation frameworks, negotiate fair employment contracts, plan corporate expansions, manage operational risk, and make informed career development decisions.
Corporate Compensation Planning and Retention Strategies
Human Resources departments use benchmark reports to perform annual compensation reviews. By comparing internal staff pay against external 50th and 75th percentile markers, organizations identify flight risks among critical staff members.
Adjusting pay proactively reduces costly turnover and avoids the expenses associated with advertising, recruiting, and onboarding replacement staff.
Career Management and Salary Negotiations
Individual professionals use verified market reports during performance reviews and job offer negotiations. Objective market figures replace subjective claims regarding compensation expectations.
Candidates evaluate whether an offer reflects current regional norms for their title, years of experience, and technical certifications.
Strategic Site Selection and Business Expansion
When companies expand into new cities within the United Kingdom, they examine workforce reports to assess local talent density and average operating costs. Comparing labor expenses between regions allows decision-makers to choose cost-effective expansion locations with adequate local labor supply. Understanding [workforce reports] is crucial for evaluating regional talent availability.
Summary of UK Workforce Trends
Salary and workforce reports serve as critical tools for navigating the United Kingdom’s labor market. By collecting, anonymizing, and standardizing complex compensation data, these publications deliver accurate market intelligence to organizations, workers, and policy planners.
Whether tracking digital transformation in technology, addressing staffing demands in healthcare, or managing pay structures in financial services, workforce reports provide the factual baseline required to maintain economic efficiency and competitiveness across all UK sectors. Organizations seeking deeper analysis on distribution channels can review how these reports reach UK business leaders by accessing a dedicated [workforce analytics media] framework.