
An interactive research report is a digital publication that allows users to manipulate datasets, filter charts, and input custom parameters directly within the interface to generate personalized insights.
Traditional document formats lock information inside fixed pages. Digital interactive research environments replace static layouts with dynamic controls. Users adjust sliders, select dropdown menus, and click data points to change visualizations in real time.
Publishers deploy these assets on web browsers using JavaScript libraries and responsive design frameworks. Readers access specific data subsets instantly without downloading files.
Defining core characteristics
Digital research tools process user inputs through embedded code scripts. These scripts update Document Object Model elements instantly.
Key attributes include:
- Dynamic data filtering based on user-selected criteria
- Embedded calculators for customized financial or operational projections
- Hover tooltips displaying exact data coordinates
- Responsive layouts functioning across desktop and mobile browsers
How does an interactive report differ from a static PDF?
Static PDFs present fixed text and rasterized images on unchangeable pages, whereas interactive reports empower users to query databases, toggle data layers, and customize visual outputs dynamically.
The structural differences change how audiences consume information. A Portable Document Format file delivers a linear reading experience.
Readers scroll sequentially from page one to the end. Modifying the displayed data requires publishers to release entirely new document versions.
Interactive web reports decouple data from presentation layers. The backend database feeds a frontend interface where users dictate what information appears.
Publishers update the underlying database without altering the user interface framework. This architecture reduces redundancy and eliminates version control errors common in corporate publishing cycles.
Comparative structure breakdown
- Data Manipulation: PDFs display predetermined figures. Interactive reports execute real-time calculations based on user parameters.
- Engagement Metrics: PDFs track total downloads only. Interactive reports measure exact user interactions, click paths, and dwell times.
- Accessibility: PDFs require external reader software. Interactive reports load natively inside standard web browsers.
Explore More Expert Insights:
How Online Retailers Recover Abandoned Carts Using Banner Advertising
How E-commerce Stores Boost Sales Using Retargeting Banner Ads
What are the core components of interactive data tools?
Interactive data tools consist of a structured database backend, a scripting calculation engine, and a responsive frontend graphical user interface.
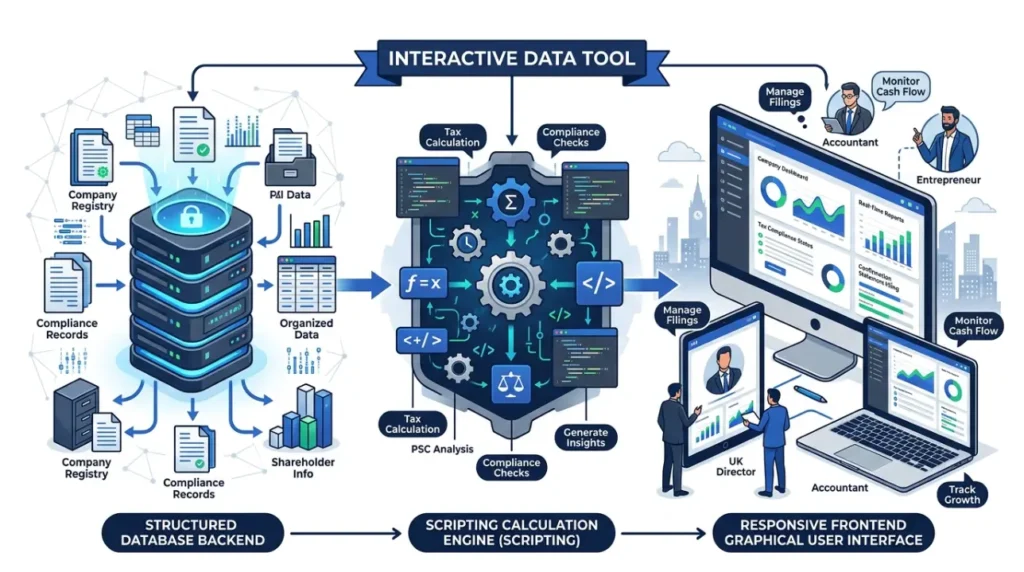
Building functional data assets requires three distinct technical layers. The data layer stores raw information in structured formats such as JSON or SQL databases.
The logic layer processes user inputs, executes mathematical functions, and filters variables. The presentation layer renders the visual charts, graphs, and input fields.
Developers utilize frameworks like React or D3.js to render complex graphics. These libraries ensure smooth transitions when users change parameters.
Performance optimization prevents lag during large dataset queries.
Essential architectural elements
- Database Schema: Organizes raw information into relational tables for rapid querying.
- Input Controls: Sliders, checkboxes, and text fields capture user parameters accurately.
- Visualization Engine: Translates processed data points into readable charts, maps, and diagrams.
Why do organizations adopt interactive formats over documents?
Organizations adopt interactive formats because dynamic web pages generate higher user engagement, longer session durations, and superior search engine visibility compared to downloadable documents.
Search engine crawlers index HTML text and structured data effectively. PDF indexing remains limited, which restricts organic discovery.
Web-based research reports capture valuable keyword rankings across competitive search engine results pages.
User retention increases when audiences participate in data exploration. Readers spend minutes manipulating variables rather than skimming static text.
Organizations capture valuable behavioral analytics by tracking user interactions with specific data points.
Measurable engagement advantages
- Higher organic search traffic through indexable HTML architecture
- Extended time-on-page metrics via active user participation
- Enhanced brand authority through advanced digital experiences
What use cases suit interactive research publishing?
Industry market analyses, economic forecasts, financial benchmarking surveys, and demographic studies represent ideal use cases for interactive research publishing.
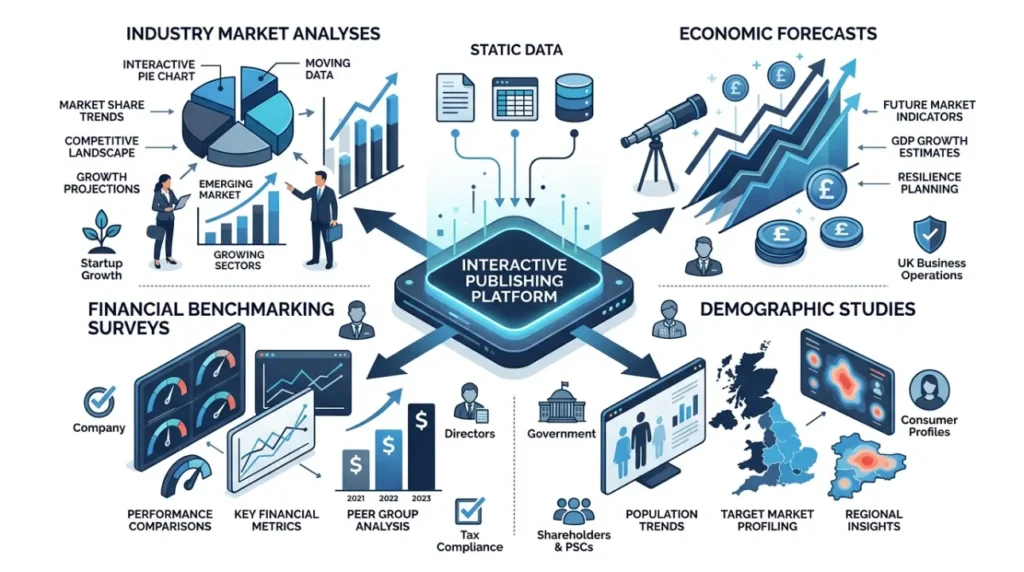
Complex datasets benefit significantly from dynamic presentation. Financial benchmarking reports allow corporate finance teams to input their specific revenue figures and compare performance against sector averages instantly.
Energy sector analyses utilize interactive maps where users toggle geographic regions to view consumption metrics.
Human resources studies incorporate salary calculators. Employers input job titles and geographic regions to retrieve localized compensation benchmarks without reading dense multi-page documents.
Practical application scenarios
- Financial Benchmarking: Custom revenue and expenditure comparisons across peer groups.
- Geographic Market Sizing: Regional demographic filtering via interactive map overlays.
- Salary Survey Calculators: Dynamic compensation filtering by sector and experience level.
How do publishers design effective interactive reports?
Publishers design effective interactive reports by defining clear user personas, structuring clean underlying datasets, and prioritizing minimalist interface designs.
The development process begins with audience research. Publishers identify what specific questions readers need answered.
Data cleansing ensures the backend database contains no null values or formatting inconsistencies that break calculation scripts.
Interface design requires strict adherence to usability standards. Cluttered dashboards confuse users and increase bounce rates.
Developers restrict initial views to high-level summaries while providing progressive disclosure options for granular data exploration.
Step-by-step production workflow
- Audience Analysis: Determine the primary analytical goals of target readers.
- Data Auditing: Cleanse, normalize, and structure raw datasets for web integration.
- Interface Prototyping: Sketch wireframes for input controls and visual displays.
- Code Implementation: Build frontend and backend systems using modern web frameworks.
- User Testing: Evaluate performance, responsiveness, and calculation accuracy across devices.
Interactive research reports replace static documents with dynamic web applications. They empower users to filter datasets, execute calculations, and customize visual outputs in real time.
Adoption of these digital formats drives higher engagement, superior search engine optimization performance, and deeper audience insights.
Publishers across finance, healthcare, and technology sectors utilize these tools to transform complex data into actionable, user-driven experiences.