
An interactive data companion is a digital web application that transforms static data from research publications into dynamic tools like calculators or filterable charts. These applications allow users in the United Kingdom to input custom parameters, filter data points by sector, and instantly view tailored analytical outputs.
Publishing static research documents limits audience engagement because PDF files restrict data manipulation. Interactive data companions solve this limitation by housing raw dataset values inside relational databases linked to front-end JavaScript frameworks. Users access these companions via standard web browsers without downloading separate software applications.
Core Characteristics of Digital Companions
- Relational database backends storing structured numerical datasets.
- Front-end user interfaces featuring sliders, drop-down menus, and search bars.
- Real-time calculation engines rendering dynamic visualizations instantly.
Organizations deploying these web tools observe higher user retention rates compared to traditional publication formats. Readers exploring foundational concepts can review [What Is an Interactive Research Report and How Does It Differ From a Static PDF?].
Why Do UK Businesses Build Interactive Data Tools for Research?
UK businesses build interactive data tools to increase user engagement, capture proprietary leads, and improve search engine visibility for competitive industry keywords. Interactive assets generate measurable user interactions that static documents cannot track through standard web analytics platforms.
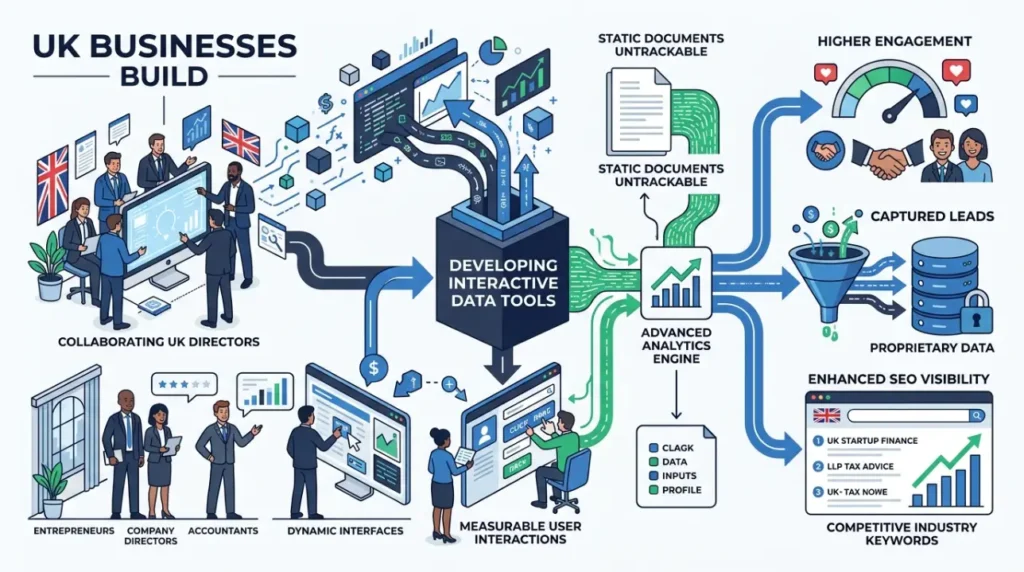
Static PDFs fail to provide behavioral insights regarding which specific data points interest target audiences. Interactive web applications track user inputs, popular filter selections, and total calculation frequencies. This telemetry data informs future research investments and content marketing strategies for British enterprises.
Key Drivers for Digital Tool Adoption
- Increased dwell time on domain pages due to active user participation.
- Higher backlink acquisition rates from industry journalists and academic institutions.
- Enhanced brand authority through transparent, accessible data modeling.
Media agencies specializing in research distribution often recommend pairing long-form studies with functional utilities. Organizations evaluating outsourced production pipelines can examine [Time Intelligence Media Group Research and Reports Services Including Interactive Data Tools].
Explore More Expert Insights:
Headlines for Sponsored Articles: 9 Formulas That Drive UK News Reader Clicks
Sponsored Content Calendar Planning: A 12-Month UK Framework for B2B Brands
How Do You Plan the Architecture of a Research-Based Calculator?
Planning the architecture of a research-based calculator requires defining the core dataset, mapping user input variables, and establishing the mathematical formulas that govern output generation. Developers structure these requirements before writing code to ensure seamless data flow between the user interface and the calculation engine.
The planning phase dictates the success of the final digital asset. Project teams isolate the most compelling datasets from the broader industry report. For example, a financial services report containing salary benchmarks across 12 UK regions requires a database schema with primary keys for geographic locations, job titles, and experience tiers.
Architectural Planning Steps
- Dataset Normalization: Cleaning raw spreadsheet files into structured SQL or JSON formats.
- Variable Mapping: Identifying input fields required from the user to execute calculations.
- Output Specification: Determining whether results appear as numerical figures, dynamic charts, or downloadable data summaries.
Rigorous planning prevents costly redevelopment phases during the coding lifecycle. Technical leads verify that mathematical models match the printed findings published in the primary research report.
What Technology Stack Is Required to Develop Filterable Charts?
Developing filterable charts requires a technology stack comprising HTML5, CSS3, front-end JavaScript charting libraries, and a lightweight front-end framework. This stack processes dataset arrays locally in the browser to render instantaneous visual updates when users apply filters.
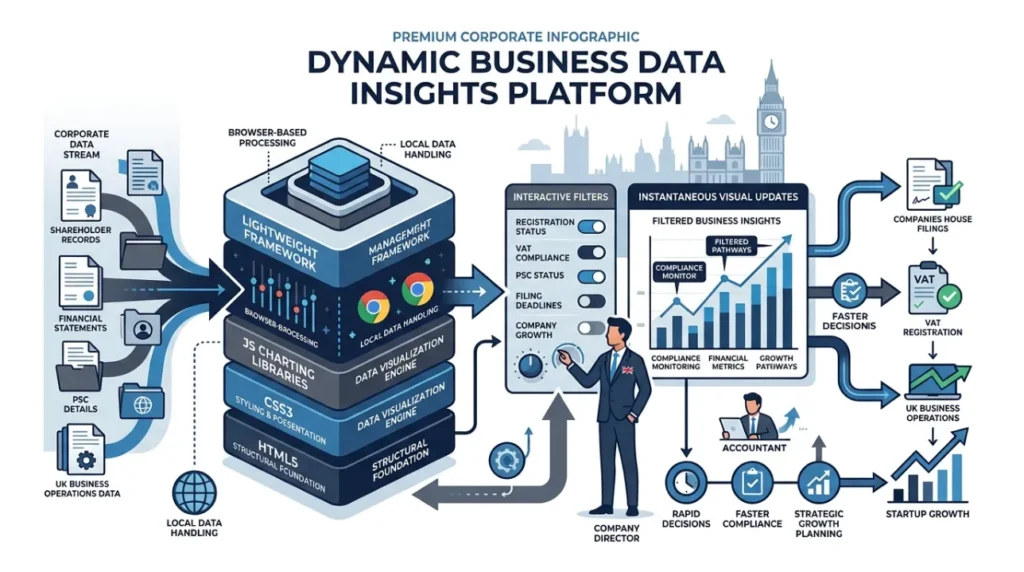
Modern web browsers execute complex data filtering tasks efficiently without requiring server-side processing for datasets under 5 megabytes. Developers utilize specific libraries designed for performance and accessibility compliance across desktop and mobile viewports.
Standard Technology Components
- Chart.js or D3.js: JavaScript libraries rendering responsive SVG and canvas visual graphics.
- React or Vue.js: Front-end frameworks managing state changes when users toggle filter parameters.
- Tailwind CSS: Utility-first styling frameworks ensuring responsive layout design across devices.
Selecting lightweight libraries guarantees fast page load speeds. Fast load speeds improve search engine rankings and reduce bounce rates among professional audiences accessing reports on mobile devices.
How Can Organizations Promote Interactive Data Companions for Maximum Reach?
Organizations promote interactive data companions by executing targeted digital PR campaigns, optimizing technical metadata for search engines, and embedding tool widgets within industry newsletters. Strategic outreach to trade publications in the United Kingdom generates high-authority backlinks that drive organic referral traffic.
Building the tool represents only the initial phase of deployment. Promotion strategies must target professionals seeking actionable data assets rather than general consumers. Outreach teams pitch the interactive utility directly to sector-specific journalists who require empirical data sources for their own reporting.
Effective Promotion Tactics
- Embedded Outreach: Supplying iframe embed codes to partner websites and industry blogs.
- Social Media Teasers: Publishing short video clips demonstrating calculator outputs on professional networks.
- Search Engine Optimization: Targeting commercial keywords related to sector calculators and data benchmarks.
Combining robust technical development with disciplined promotion turns research reports into durable, long-term lead-generation engines.