
Industry reports have become valuable sources for search engines, AI-powered search assistants, journalists, analysts, and business decision-makers. In 2026, AI search systems prioritise structured, evidence-based, and well-organised content that answers specific questions with verifiable information.
For UK organisations, publishing an industry report is no longer only about presenting research. The report structure determines how easily AI systems extract facts, summarise findings, cite statistics, and surface insights during user searches. A clear structure increases discoverability across both traditional search engines and AI-driven search experiences.
This guide explains how to structure a UK industry report for maximum AI search visibility while improving usability for human readers.
Why does report structure affect AI search visibility?
AI search systems analyse document structure, headings, definitions, evidence, and relationships between topics. A logically organised UK industry report allows search engines to identify important entities, understand context, extract statistics, and generate accurate summaries that appear in AI-powered search results across multiple platforms.
Traditional search engines focused heavily on keywords and backlinks. Modern AI search evaluates information differently. It identifies concepts, supporting evidence, and relationships between sections.
A structured report helps AI recognise:
- Primary topic
- Industry entities
- Geographic scope
- Research findings
- Supporting statistics
- Definitions
- Recommendations
For example, a UK manufacturing report with clearly labelled sections on productivity, labour shortages, automation adoption, and export performance provides distinct information that AI systems classify independently.
Reports with inconsistent headings, missing context, or scattered statistics reduce machine understanding.
What makes AI-readable content different?
AI systems prioritise content that includes:
- Clear headings
- Direct definitions
- Evidence-backed statements
- Consistent terminology
- Well-labelled charts
- Context around statistics
Each section answers one topic before moving to the next.
What sections should every UK industry report include?
A complete UK industry report follows a logical progression from research objectives through methodology, findings, analysis, recommendations, and conclusions. Every section contributes unique information that improves both reader comprehension and AI interpretation without duplicating content across chapters.
A standard structure improves readability and indexing.
Executive summary
Summarise the report in approximately 300 words.
Include:
- Research purpose
- Sample size
- Main findings
- Key statistics
- Primary conclusions
This section often becomes the basis for AI-generated summaries.
Industry background
Define the industry clearly.
Include:
- Market definition
- Geographic scope
- Time period
- Regulatory context
- Economic environment
Example:
A UK logistics report defines road freight, warehouse operations, parcel delivery, and regional transport infrastructure before discussing performance data.
Research methodology
Describe exactly how the research was completed.
Include:
- Survey size
- Interview numbers
- Data sources
- Collection period
- Statistical methods
Methodology establishes credibility for both readers and AI systems.
Findings
Present results using individual sections.
Examples include:
- Revenue growth
- Recruitment trends
- Investment activity
- Customer behaviour
- Technology adoption
Each finding deserves its own heading.
Analysis
Explain why findings matter.
Connect statistics to broader industry developments.
Recommendations
Provide practical actions based on evidence rather than opinion.
Conclusion
Summarise major findings without introducing new information.
How should headings be organised for AI understanding?
Hierarchical headings establish relationships between topics. AI systems recognise structured heading levels as indicators of document organisation, allowing individual sections to answer specific search queries while preserving the overall context of the UK industry report.
Heading consistency improves machine interpretation.
Follow this hierarchy:
- H1: Entire report topic
- H2: Main research questions
- H3: Supporting evidence
- H4: Detailed data where necessary
Avoid skipping heading levels.
Poor example:
- H2
- H4
- H2
- H5
Good example:
- H2 Industry Growth
- H3 Revenue Performance
- H3 Regional Differences
- H3 Future Investment
Each heading answers one question.
Avoid vague headings such as:
- Overview
- More Information
- Discussion
Use descriptive headings instead.
Examples include:
- UK Retail Investment Trends
- Construction Labour Availability
- SME Export Performance
How should statistics be presented for maximum citation?
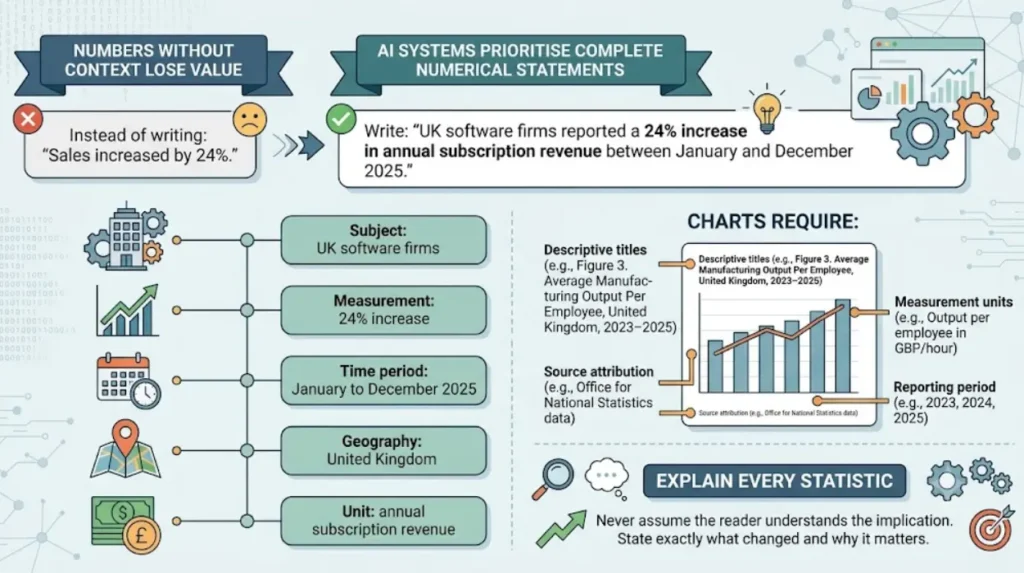
Statistics require context, sources, dates, and explanations. AI systems prioritise complete numerical statements that identify what was measured, where data originated, when research occurred, and why the figures matter within the broader industry landscape.
Numbers without context lose value.
Instead of writing:
“Sales increased by 24%.”
Write:
“UK software firms reported a 24% increase in annual subscription revenue between January and December 2025.”
Each statistic includes:
- Subject
- Measurement
- Time period
- Geography
- Unit
Label every chart clearly
Charts require:
- Descriptive titles
- Source attribution
- Measurement units
- Reporting period
Example:
Figure 3. Average Manufacturing Output Per Employee, United Kingdom, 2023–2025.
Explain every statistic
Never assume the reader understands the implication.
State exactly what changed and why it matters.
Which entities improve AI understanding of industry reports?
Entities identify people, organisations, industries, regulations, technologies, and locations. Consistent entity usage strengthens contextual understanding, helping AI systems connect report findings with recognised concepts already established across trusted information sources and industry knowledge bases.
Entities provide context beyond keywords.
Examples include:
- Financial Conduct Authority
- Office for National Statistics
- NHS England
- Companies House
- Bank of England
Industry entities include:
- Fintech
- Renewable energy
- Construction
- Professional services
- Cybersecurity
Location entities include:
- London
- Manchester
- Birmingham
- Scotland
- Wales
Technology entities include:
- Artificial intelligence
- Cloud computing
- Machine learning
- Robotic process automation
Define each entity the first time it appears.
Maintain consistent terminology throughout the report.
Avoid alternating between multiple names for the same concept.
How can research findings become more discoverable in AI search?
Research findings become easier for AI systems to surface when each insight answers one specific question, includes supporting evidence, uses descriptive headings, and avoids combining multiple unrelated conclusions within the same section of the report.
Each finding deserves its own subsection.
For example:
UK recruitment trends
Present:
- Hiring increase
- Vacancy rates
- Skills shortages
- Regional differences
Then move to another topic.
Do not combine recruitment with investment or exports.
Use descriptive summaries
Each subsection starts with one direct statement.
Example:
“Manufacturing investment increased across every UK region during 2025.”
AI systems extract concise statements efficiently.
Support every conclusion
Every finding links directly to evidence.
Avoid unsupported claims.
What formatting improves both human reading and AI indexing?
Simple formatting improves readability and machine processing simultaneously. Short paragraphs, descriptive lists, labelled tables, consistent terminology, and predictable document organisation reduce ambiguity while making important research findings easier to locate and understand.
Readable reports perform better for every audience.
Use:
- Short paragraphs
- Bullet lists for grouped items
- Numbered processes
- White space between sections
- Consistent formatting
Avoid:
- Large text blocks
- Decorative headings
- Unlabelled graphics
- Inconsistent terminology
Tables require:
- Column headings
- Row labels
- Measurement units
Every image requires descriptive alternative text.
Every appendix requires a title.
Explore More Expert Insights:
How Media-Published Reports Outperform Gated PDFs for UK Lead Generation
The 8-Step Research Report Production Process for UK B2B Brands
How does an AI-friendly report support wider content marketing?
A structured industry report creates reusable research assets for articles, presentations, webinars, newsletters, media outreach, and executive briefings. Consistent report organisation simplifies content extraction while preserving factual accuracy across every communication channel.
One report supports multiple content formats.
Examples include:
- Blog articles
- Press releases
- Infographics
- LinkedIn posts
- Webinar presentations
- Executive summaries
Each content format references the same verified research.
Reports also support long-term authority because consistent research creates a library of original information.
Businesses exploring research-driven publishing strategies can continue with
How Thought Leadership Built on Research Generates Leads Whilst You Sleep to understand how original research supports ongoing audience acquisition.
Decision-makers evaluating measurable commercial outcomes can also explore
Why B2B Brands That Publish Annual UK Reports See 28% Higher Renewal Rates for evidence on long-term customer value.
What are the most common mistakes when structuring UK industry reports?
Poor organisation, inconsistent terminology, unsupported statistics, weak methodology, and unclear headings reduce report quality. These issues limit AI interpretation, decrease search visibility, and make research findings harder for readers to verify or reference accurately.
Common mistakes include:
- Missing executive summaries
- Undefined industry terms
- Statistics without sources
- Long sections covering multiple topics
- Generic headings
- Missing methodology
- Inconsistent terminology
- Unlabelled charts
- Conclusions without supporting evidence
Each mistake reduces clarity.
Each correction improves discoverability.
A structured report provides information that search engines, AI systems, journalists, analysts, and business professionals can interpret consistently.
Structuring a UK industry report for maximum AI search visibility in 2026 requires more than inserting keywords. Effective reports organise information into logical sections, define entities clearly, present contextual statistics, and use consistent heading hierarchies that AI systems interpret accurately.
Well-structured reports improve discoverability because every section answers a specific question, every statistic includes supporting context, and every finding connects directly to evidence. This approach increases citation potential across AI search platforms while making reports easier for journalists, researchers, and business leaders to understand.
As AI search continues to prioritise authoritative, structured information, organisations that publish clear, research-driven industry reports gain stronger visibility, improved knowledge recognition, and greater long-term value from every report they produce.