

A research report production process is a structured sequence of eight defined steps that convert a business question into a published, evidence-based report with clear methodology, findings, and recommendations.
A research report is an organised document that presents objectives, methods, results, and conclusions. Key entities are the research brief, sample frame, data-collection instruments, analysis scripts, and the final report. A production process ensures repeatability, auditability, and alignment with business goals. UK B2B brands use this process to inform strategy, validate propositions, and support stakeholder decisions.
Why start with a clear research brief?
A research brief defines the primary question, target audience, metrics, timeline, budget, and stakeholders in a single document for alignment and scope control.
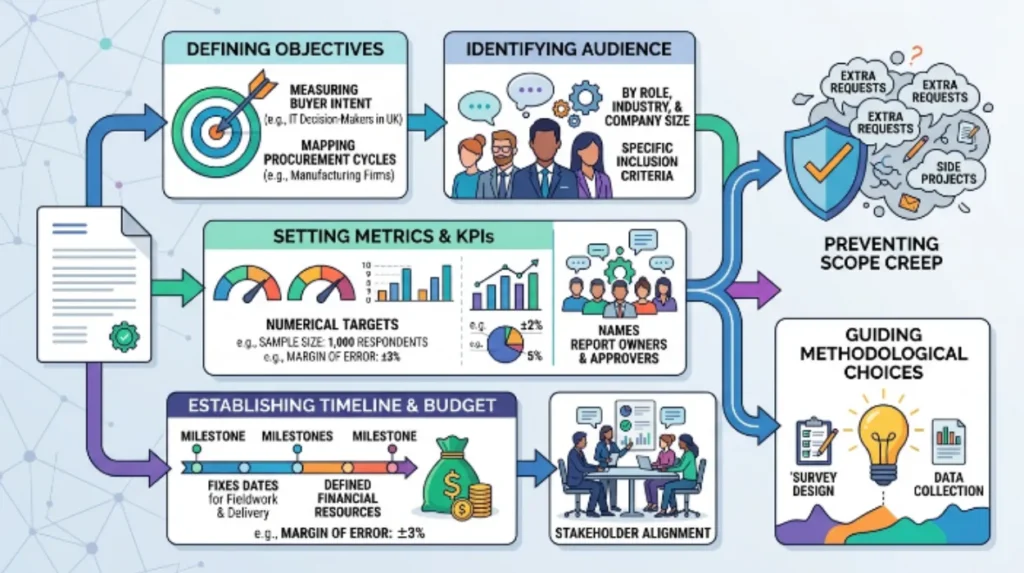
The brief sets the objective such as measuring buyer intent among IT decision-makers in the UK or mapping procurement cycles for manufacturing firms. It identifies audiences by role, industry, and company size with specific inclusion criteria. The brief lists key performance indicators as numerical targets, for example, sample size of 1,000 respondents and margin of error of ±3%. The brief fixes dates for fieldwork and delivery and names report owners and approvers. This document prevents scope creep and guides downstream methodological choices.
What is involved in sample design and recruitment?
Sample design selects the population, sampling frame, and method (probability or quota) and specifies sample sizes for representativeness and sub-group analysis.
Define the population such as UK B2B buyers in mid-market firms with annual revenue between £10m and £250m. Choose a sampling frame like business panels, customer databases, or trade association lists. Select sampling methods: random probability sampling for statistical inference; quota sampling for speed. Calculate sample size using desired confidence level, typically 95%, and acceptable margin of error, for example ±4% for n≈600. Specify quotas for roles, sectors, and regions. Document recruitment scripts, incentives, and eligibility screening to ensure compliance and transparency.
How should instruments and questions be designed?
Design instruments with validated question wording, defined response scales, routing logic, and pilot testing to ensure reliability and validity.
Create survey items that measure constructs clearly, such as purchase intent scored on a 5-point Likert scale where 1 = very unlikely and 5 = very likely. Use single-concept questions to avoid double-barrel wording. Include demographic and firmographic items with discrete categories. Specify routing to skip irrelevant sections. Implement piloting on 30 to 50 respondents to check timing and comprehension. Revise instruments based on pilot feedback and cognitive testing. Document final instrument and question definitions for reproducibility.
What data-collection procedures ensure quality?
Data collection uses defined modes (online, phone, interview), scripted protocols, quality-check rules, and monitoring to produce reliable data within the scheduled field window.
Select modes aligned with the target audience; for senior executives use phone or booked interviews, for operational roles use online panels. Set fieldwork windows, for example 10 business days for online surveys, 15 for phone interviews. Implement quality-control checks such as minimum completion time, attention checks, and logic consistency checks. Track response rates and replacement strategies for quotas. Log recruitment sources and timestamps. Maintain data security controls and consent records in line with UK data protection rules.
How is data cleaning and preparation conducted?
Data cleaning applies predefined rules for missing values, outliers, duplicate records, variable coding, and weighting to prepare datasets for analysis.
Define missing-value rules such as treating responses with more than 50% missing answers as unusable. Identify outliers using statistical thresholds and review case notes before removal. De-duplicate cases by ID and timestamp. Recode categorical responses into standard variables and label value sets. Compute derived variables such as net promoter scores or composite indices using documented formulas. Apply weighting to adjust the sample to population benchmarks for industry, company size, or region using raking or post-stratification. Save cleaned datasets and analysis logs for audit.
What analysis methods produce actionable findings?
Apply descriptive statistics, cross-tabulation, regression analysis, and confidence-interval reporting to generate robust, actionable findings with clear interpretation rules.
Start with descriptive metrics: means, medians, and frequency distributions. Use cross-tabulation to compare segments like sector and buyer role. Apply regression models to test associations while controlling for covariates, and report coefficient estimates with standard errors and p-values. Present confidence intervals at the 95% level for key metrics. Document model specifications, assumptions, and goodness-of-fit measures. Where applicable, run sensitivity analyses and present results for primary and holdout samples to demonstrate stability.
How are findings documented and validated?
Document findings in a structured results section, validate through triangulation or replication, and include transparent methodological appendices and code.
Write a results narrative that includes headline metrics, segment comparisons, and ranked lists of drivers. Validate outcomes by comparing with secondary sources such as industry reports, publicly available datasets, or historical company data. Replicate key analyses on a holdout sample or fresh data when possible. Include appendices with the full methodology, questionnaire, sampling frame, raw tables, and analytic code in R, Python, or Stata. Provide a limitations section that lists known biases, measurement errors, and external validity constraints with numerical estimates where available.
Explore More Expert Insights:
How to Repurpose One Research Report Into 14 Separate UK Content Assets
Long-Form Report vs White Paper vs Infographic: Which UK Format Converts Best?
What are best practices for report production and design?
Structure the report with an executive summary, methodology, findings, implications, and technical appendices, and apply consistent templates and version control for publication readiness.
Executive summaries present 3 to 5 core findings with numeric evidence and confidence levels. Methodology sections detail sampling, instruments, field dates, and weighting protocols. Findings sections include charts, tables, and concise captions that name variables and units. Implications translate findings into strategic questions for stakeholders without prescribing vendor solutions. Appendices hold raw data tables, questionnaire text, and code. Use version control and a single-source document to manage edits and track approvals. Apply accessible design standards for readability and accessibility compliance.
When should brands convert research into content and campaigns?
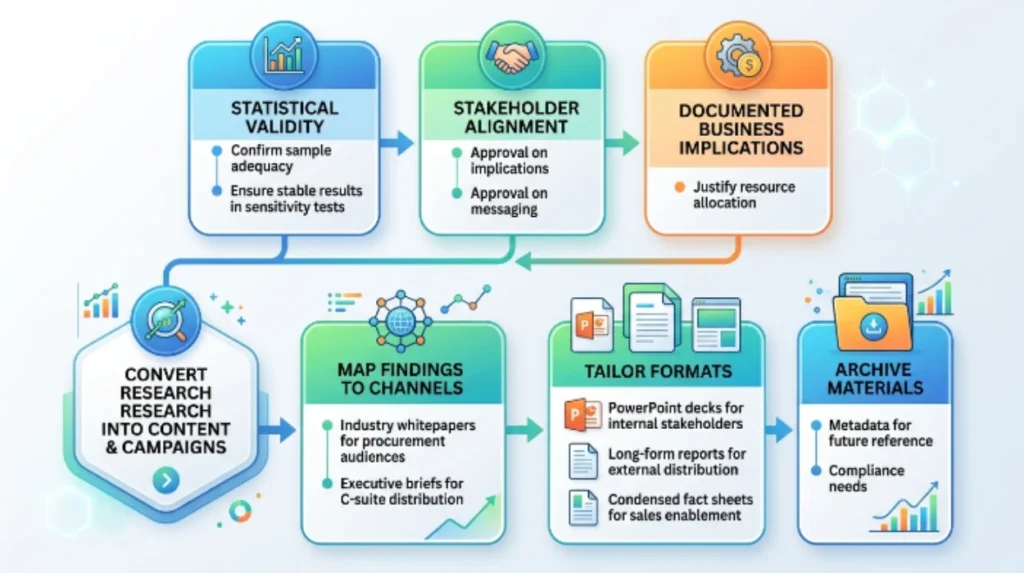
Convert research into content and campaigns when findings have statistical validity, stakeholder alignment, and documented business implications that justify resource allocation.
Confirm statistical validity through sample adequacy and stable results in sensitivity tests. Seek stakeholder approval on implications and messaging. Map findings to communications channels, for example industry whitepapers for procurement audiences and executive briefs for C-suite distribution. Tailor formats: PowerPoint decks for internal stakeholders, long-form reports for external distribution, and condensed fact sheets for sales enablement. Archive all materials and metadata for future reference and compliance needs.
Explore the Complete Guide:
Why 96% of UK Marketers Now Use AI Tools and Why Research Still Beats Them
A repeatable eight-step production process transforms research questions into validated, publishable reports for UK B2B brands. The process prioritises a clear brief, representative sampling, validated instruments, quality-controlled data collection, rigorous cleaning, statistic call sound analysis, transparent documentation, and controlled publication. Use these elements to balance speed with rigour and to convert evidence into strategic conversations.
Discover More Insights:
Publishing Your Research Through a 10-Site UK Media Group: Reach and Credibility Compared



