
Real estate businesses collect large volumes of market data through property transactions, pricing trends, buyer behaviour, rental performance, planning activity, and regional development. When organised into a structured report, this proprietary information becomes a credible media asset that supports brand authority, search visibility, and industry recognition. A systematic process ensures reports meet editorial standards, provide genuine public value, and attract consistent media attention.
What is a proprietary real estate market report?
A proprietary real estate market report is an original publication based on exclusive data collected, analysed, and interpreted by a property organisation. It presents verified market findings, identifies measurable trends, and delivers evidence that journalists, investors, developers, and industry professionals reference confidently.
A proprietary report differs from a general property blog because it contains exclusive information rather than summarised public statistics.
Typical proprietary datasets include:
- Residential sale prices
- Commercial property demand
- Rental yields
- New housing supply
- Planning applications
- Regional investment activity
For example, a nationwide developer can analyse 8,000 completed property transactions across England during one quarter. The resulting report represents original market intelligence unavailable elsewhere.
Original research increases credibility because media organisations prioritise exclusive information over repeated commentary.
Why do journalists value original real estate market data?
Journalists publish evidence that explains current market conditions with measurable facts. Proprietary reports provide exclusive statistics, verified trends, and clear regional comparisons that strengthen reporting accuracy while reducing dependence on widely circulated public information already available across competing publications today.
Property editors work within strict publication deadlines.
They require information that includes:
- Verified statistics
- Clear methodology
- Recent market activity
- Relevant regional insights
- Quotable findings
A report stating that “average apartment prices increased by 11.8% across Birmingham city centre during six months” provides a stronger news angle than general statements about improving demand.
Editors also prefer reports containing geographic comparisons.
Examples include:
- Manchester versus Leeds
- London versus Bristol
- Glasgow versus Edinburgh
These comparisons help publications create localised coverage for different audiences.
How do you select data that creates newsworthy reports?
Newsworthy reports focus on measurable changes affecting property buyers, investors, developers, lenders, landlords, and local authorities. Selecting statistically significant information ensures each report answers important market questions supported by reliable evidence instead of broad market commentary alone.
Not every dataset deserves publication.
Strong reports answer practical questions.
Which datasets generate stronger coverage?
Examples include:
- First-time buyer affordability
- Rental inflation
- Commercial vacancy rates
- Student housing demand
- Green building adoption
- Planning approval timelines
- Build-to-rent performance
- Luxury housing growth
Each topic addresses a specific market concern.
Which metrics strengthen credibility?
Include measurable indicators such as:
- Percentage change
- Annual growth
- Quarterly movement
- Median pricing
- Transaction volume
- Regional rankings
- Supply shortages
Numbers improve clarity and support factual reporting.
How do you structure a report that media outlets understand?

An effective market report follows a logical structure with transparent methodology, executive findings, supporting evidence, regional analysis, charts, and expert commentary. Clear organisation enables journalists to locate relevant information quickly and reference verified statistics accurately within published stories.
Editors rarely read reports from beginning to end.
They search for usable information immediately.
A practical report structure includes:
Executive summary
Present the five most important findings.
Include numerical highlights.
Research methodology
Explain:
- Data source
- Sample size
- Reporting period
- Geographic coverage
- Analytical process
Transparent methodology increases confidence.
Market findings
Present evidence using headings.
One trend belongs in one section.
Regional comparisons
Separate findings by location.
For example:
- South East England
- North West England
- Midlands
- Scotland
- Wales
Visual data
Include:
- Bar charts
- Line graphs
- Heat maps
- Ranking tables
Visual elements simplify interpretation.
Expert interpretation
Explain what the figures indicate without speculation.
How can data visualisation improve media use?
Well-designed charts transform complex property statistics into information that editors understand quickly. Clear visualisation improves accuracy, simplifies comparisons, and increases opportunities for newspapers, trade publications, and digital media to reference report findings within published articles consistently.
Journalists often reuse charts directly.
Simple graphics improve usability.
Useful visual formats include:
- Quarterly trend graphs
- Regional price maps
- Rental growth rankings
- Supply versus demand comparisons
- Investment heat maps
Every graphic requires:
- Source attribution
- Date
- Units of measurement
- Clear labels
Avoid decorative graphics.
Every chart must communicate one measurable finding.
How do you create multiple media stories from one report?
One comprehensive report contains numerous independent news angles. Segmenting findings into individual themes increases publication opportunities because different media organisations prioritise different audiences, industries, and regional developments across the United Kingdom throughout the reporting cycle.
A 40-page report rarely becomes one article.
Instead, separate findings into individual stories.
Examples include:
- Regional house price growth
- Affordable housing shortages
- Rental market changes
- Student accommodation demand
- Commercial office recovery
- Green construction investment
- New housing approvals
Each topic supports different publications.
National newspapers focus on broader trends.
Regional newspapers prioritise local statistics.
Trade publications prefer specialist analysis.
Businesses refining this approach often compare structured research promotion with:
How High-Authority Business Backlinks Resurrect Online Visibility for Struggling Construction Brands to understand how authoritative content strengthens both media visibility and search performance.
What supporting assets strengthen report distribution?
Supporting materials help journalists produce accurate stories efficiently. Executive summaries, media fact sheets, quotations, infographics, and high-resolution charts save preparation time and keep published articles consistent with original research findings across multiple publications at once.
A report alone rarely maximises visibility.
Supporting assets improve accessibility.
Useful assets include:
Executive briefing
Provide one-page highlights.
Fact sheet
List key statistics.
Infographics
Summarise complex findings visually.
Media-ready quotations
Prepare concise expert comments supported by report evidence.
Image library
Include:
- Development photography
- Regional property images
- Maps
- Data graphics
Each asset serves a different editorial purpose.
How do proprietary reports strengthen long-term marketing performance?
Original research supports search visibility, brand authority, media credibility, backlink acquisition, lead generation, and stakeholder confidence. Repeated publication establishes a recognised source of property intelligence that attracts consistent attention throughout multiple reporting periods and evolving market cycles.
Reports create value beyond media coverage.
They become long-term knowledge assets.
Benefits include:
Stronger search visibility
Original research attracts references from industry publications.
These references strengthen authority.
Higher-quality backlinks
Authoritative publications frequently cite exclusive statistics.
Better stakeholder engagement
Investors prefer evidence-based decision support.
Developers use reports during project planning.
Estate agencies reference local market intelligence.
Improved speaking opportunities
Conference organisers frequently invite researchers who publish recognised market reports.
Stronger industry reputation
Consistent publication establishes expertise through measurable evidence.
Explore More Expert Insights:
The Developer’s Guide to Crafting High-Impact Press Releases for Groundbreaking Ceremonies
Integrating Strategic Press Distribution into Your National Product Rollout Checklist
What process turns research into a repeatable media asset?
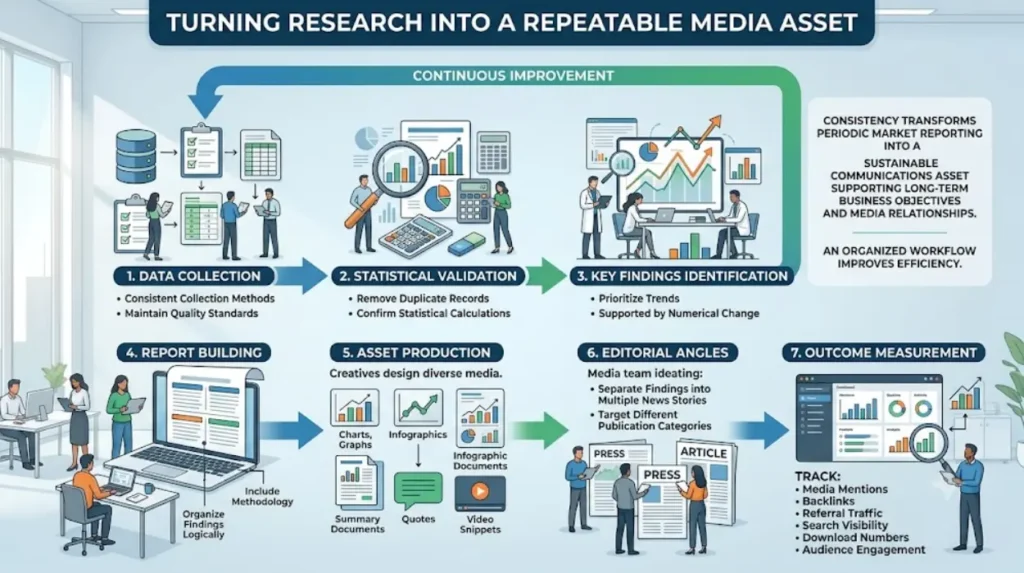
A repeatable framework combines data collection, statistical validation, editorial planning, visual production, distribution preparation, publication measurement, and continuous improvement. Consistency transforms periodic market reporting into a sustainable communications asset supporting long-term business objectives and media relationships.
An organised workflow improves efficiency.
A repeatable process includes:
Step 1: Collect verified data
Use consistent collection methods.
Maintain quality standards.
Step 2: Validate accuracy
Remove duplicate records.
Confirm statistical calculations.
Step 3: Identify key findings
Prioritise trends supported by significant numerical change.
Step 4: Build the report
Organise findings logically.
Include methodology.
Step 5: Produce supporting assets
Prepare charts, summaries, quotations, and media resources.
Step 6: Develop editorial angles
Separate findings into multiple news stories.
Target different publication categories.
Step 7: Measure outcomes
Track:
- Media mentions
- Backlinks
- Referral traffic
- Search visibility
- Download numbers
- Audience engagement
Measurement supports continuous improvement.
Organisations evaluating structured research distribution frequently compare frameworks alongside:
ROI Case Study: How Time Intelligence Media Group Accelerated Pre-Sales for a Stalled Housing Development to understand how market intelligence integrates into broader communications strategies.
Proprietary real estate market reports transform exclusive property data into credible media assets through structured research, transparent methodology, accurate analysis, and clear presentation. Original findings provide journalists with verifiable evidence, encourage authoritative media coverage, strengthen search visibility, and create valuable long-term content resources. A repeatable reporting framework enables property organisations to produce consistent, data-driven publications that support both industry recognition and measurable marketing performance.