
A sponsored content ROI calculator quantifies return on investment by comparing revenue generated to total campaign costs using defined inputs and formulae. A sponsored content ROI calculator applies a clear formula: subtract total costs from total revenue, divide by total costs, and express the result as a percentage. Inputs include direct costs, distribution costs, creative costs, and measured revenue sources such as attributed sales, lead value, and assisted conversions. The calculator converts heterogeneous metrics into monetary terms to allow apples-to-apples comparison between campaigns.
How the calculator processes data depends on attribution choice. Last-click attribution assigns full value to the final touchpoint. Multi-touch attribution allocates fractional value across multiple interactions. First-touch attribution credits the initial contact. Marketers often use multi-touch or data-driven attribution for sponsored content because content influences awareness and mid-funnel engagement. The calculator also adjusts for viewability and fraud by applying quality filters to impressions and excluding invalid traffic.
Revenue minus costs equals net return; ROI equals net return divided by costs times 100. For example, a campaign with £12,000 revenue and £5,000 total cost yields net return £7,000 and ROI 140%. The calculator can output payback period, cost per lead, and return per thousand impressions (RPM) for programmatic buys.
What inputs does the calculator require for UK-sponsored campaigns?
Required inputs include campaign dates, total spend, creative production cost, distribution fees, impressions, clicks, attributed conversions, and average order value. Campaign dates define time windows for attribution. Total spend aggregates media buy, platform fees, and agency margins. Creative production cost covers writing, design, video editing, and licensing. Distribution fees cover platform boosts, native placements, and influencer payments. Impressions and clicks provide reach and engagement context. Attributed conversions link content exposure to customer actions. Average order value converts conversions into revenue. Additional inputs include lead-to-sale conversion rate and lifetime value for lead-based campaigns.

Viewability rate, invalid traffic percentage, and brand-safety deductions. For UK-specific inputs, consider VAT treatment for costs where relevant and local CPMs and CPCs. Example inputs for a typical UK regional campaign: total spend £8,000, production cost £1,500, distribution fees £1,200, impressions 1,200,000, clicks 9,600, attributed conversions 120, average order value £80.
What outputs should the calculator generate for clear decision-making?
Outputs should include ROI percentage, net profit, cost per acquisition, cost per lead, payback period, and RPM; include attribution breakdowns and quality-adjusted metrics. ROI percentage shows overall return. Net profit displays absolute monetary gain. Cost per acquisition (CPA) equals total cost divided by attributed conversions. Cost per lead equals total cost divided by leads. Payback period shows time to recover spend from revenue. RPM equals revenue per thousand viewable impressions, helping compare formats. Attribution breakdowns show revenue split across first, mid, and last touch. Quality-adjusted metrics report viewable RPM and invalid-traffic-adjusted CPA.
Provide scenario outputs for sensitivity analysis. Run a conservative scenario using 30% viewability, a base scenario using measured viewability, and an optimistic scenario using 70% viewability. Report results in clear numeric tables or labeled sections. For example, with revenue £12,000 and costs £10,700 the calculator yields net profit £1,300 and ROI 12.15%.
What UK industry averages inform realistic forecasts?
UK industry averages include native CPMs £5–£25, average viewability 50%, click-through-rate 0.4%–1.2%, and conversion rates 0.5%–3% depending on intent. Native CPM varies by publication quality and targeting: local and niche sites show CPMs near £5–£10; national premium sites show £20–£25. Viewability in the UK commonly averages 50% for native placements and 40% for programmatic display. CTRs for sponsored content average 0.4% on broader placements and 1.2% on high-relevance newsletters. Conversion rates vary by funnel stage: awareness content converts at 0.5% for direct sales, while lead-generation content converts at 1.5% for form sign-ups and 3% for gated content with clear intent.
Average order value varies by sector: retail averaged £60 in recent reports, travel averaged £340, and B2B services averaged £1,200 per contract. Lifetime value differs more widely; use cohort data where possible. Publisher engagement benchmarks: time on article 90–180 seconds for long-form sponsored content, scroll depth 55% median. Use these averages as priors and replace with campaign-specific data when available.
How should attribution be handled for sponsored content ROI?
Choose an attribution model, document it, and apply consistent rules to convert engagements into revenue reliably. Attribution affects reported ROI strongly. Last-click overstates direct response but understates awareness impact. Multi-touch divides value across exposure points, capturing the contribution of sponsored content that builds intent. Data-driven models use algorithmic weighting based on observed conversion paths. For UK campaigns, document whether view-through conversions count and define the view-through window in days. Typical view-through windows are 1, 7, or 30 days.
When converting leads to revenue, use observed lead-to-sale conversion rates or apply conservative benchmark rates if historical data is absent. For sponsored brand campaigns, use uplift testing via holdout groups to quantify incremental conversions. For example, run a 10% holdout where users do not see the content and measure difference in conversion rates. Use the incremental revenue as the numerator for ROI calculations to avoid double-counting baseline conversions.
What quality adjustments improve accuracy of ROI estimates?
Apply viewability, invalid-traffic filtering, and brand-safety deductions to impressions and clicks before calculating cost efficiency metrics. Filter impressions by viewability threshold, commonly 50% for display and 70% for in-feed content where interaction is expected. Subtract invalid traffic percentage from click and impression totals using ad verification reports. Deduct placements flagged for brand-safety issues and reallocate their cost as non-performing spend. Adjust conversion counts for duplicate or bot-driven leads using CRM validation.
Apply uplift measurement or A/B testing to isolate the sponsored content effect. If testing is not possible, use conservative uplift factors based on category evidence: 10% uplift for awareness-driven content in established categories, 25% uplift for targeted lead-gen content with high-intent gating. Document adjustments in the calculator output for auditability.
What benefits does using a sponsored content ROI calculator deliver for UK marketers?
A calculator produces comparable campaign metrics, supports budget decisions, reduces bias in performance assessment, and improves media mix optimisation. Comparability lets teams evaluate sponsored content against search, social, and display buys using the same financial yardstick. Clear CPA and RPM figures guide budget allocation toward higher-yield channels.
The calculator surfaces underperforming placements and over-indexed creative costs. For UK marketers, standardised outputs enable consistent reporting to stakeholders and compliance with finance teams for VAT and regional cost treatment. Over time, accumulating campaign-level results builds a UK-specific benchmark dataset and improves forecasting accuracy.
Explore More Expert Insights:
What Makes a Sponsored Content Partner Worth Paying For in the UK in 2026
Sponsored Content for UK Financial, Tech and Healthcare Brands: Vertical Benchmarks
How do marketers use outputs to decide on sponsored content investments?
Use ROI, CPA, and payback period together with strategic KPIs like brand lift and lead quality to decide whether to scale, pause, or iterate content investments. High ROI with low CPA indicates scale readiness. Low ROI but high brand lift suggests reevaluating conversion paths or adding direct-response elements. Short payback periods support investment in repeatable series or programmatic scaling. Compare RPM across publishers to identify best-value inventory. Combine quantitative outputs with qualitative readouts like survey lift and editorial fit before making long-term commitments.
For mid-funnel nurturing, use cost per lead and lead-to-sale rates to model customer acquisition cost over a 12-month horizon. For direct-sales campaigns, prioritise CPA and immediate revenue. Include scenario analysis that projects ROI at 10%, 20%, and 30% changes in conversion rates to stress-test outcomes.
What are practical use cases for the calculator in a UK context?
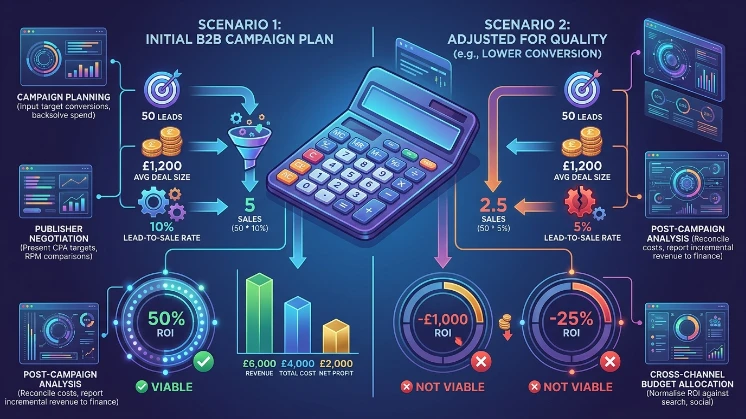
Use cases include campaign planning, publisher negotiation, post-campaign analysis, and internal financial reporting. At the planning stage, input target conversions and average order value to backsolve required spend and CPM. In publisher negotiation, present cost-per-acquisition targets and RPM comparisons rather than CPM alone. For post-campaign analysis, use the calculator to reconcile invoiced costs with delivered value and to report incremental revenue to finance. For cross-channel planning, normalise sponsored content ROI against search and paid social to allocate monthly budgets.
B2B technology buyer campaign aims for 50 leads with average deal size £1,200. With a 10% lead-to-sale rate the expected revenue equals £6,000. If total campaign cost is £4,000, net profit £2,000 and ROI 50%; adjust inputs for quality to confirm viability.
Discover More Insights:
Context Is Everything: How UK Readers Respond Differently to News-Adjacent Content
A sponsored content ROI calculator standardises campaign measurement using clear inputs, quality adjustments, and defined attribution. Use UK industry averages as priors, but replace them with campaign data when available. Report ROI, net profit, CPA, cost per lead, payback period, and RPM. Document attribution rules and quality filters for auditability.
For further exploration of nurturing tactics and mid-funnel measurement, see the following:
How to Use Sponsored Content to Nurture UK Leads Who Are Not Ready to Buy Yet