

A long-form report is an in-depth research document with data, methodology, and appendices. A white paper is a problem-solution brief with technical explanation and recommendations. An infographic is a visual summary that highlights key data points and process steps.
Define each entity precisely. A long-form report typically runs 3,000–10,000 words and includes quantitative analysis, charts, methodology, and case appendices. A white paper typically runs 1,200–3,000 words and focuses on a specific problem, proposed approach, technical pros and cons, and recommended next steps. An infographic is a single-page visual asset summarising core findings with visualised statistics, timelines, or workflows. Reports document evidence. White papers argue a recommended approach. Infographics present high-level facts for rapid consumption.
How do these formats fit the UK B2B buyer journey?
Long-form reports support discovery and validation, white papers support technical evaluation, and infographics support awareness and internal persuasion. Each format aligns with distinct buyer needs at different evaluation stages.
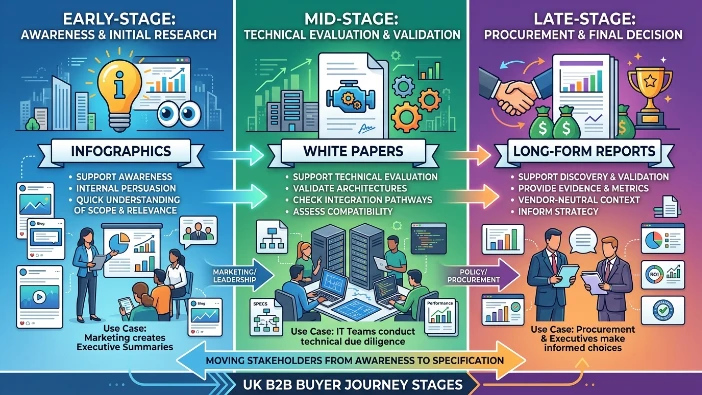
UK B2B buyers follow a staged research process. Early-stage buyers use infographics to quickly understand scope and relevance. Mid-stage technical teams read white papers to validate architectures and integration pathways. Procurement and executive stakeholders consult long-form reports for evidence, metrics, and vendor-neutral context. The formats together create a layered content ecosystem that moves stakeholders from awareness to specification. Use-case examples include policy teams using reports for strategy, IT teams using white papers for compatibility checks, and marketing using infographics for executive summaries.
Which format generates the highest engagement among UK decision-makers?
Engagement differs by role: executives and procurement engage most with long-form reports; technical leads engage most with white papers; non-technical stakeholders engage most with infographics. Engagement metric values vary by channel and placement.
Measure engagement with time-on-page, scroll depth, and content downloads. Long-form reports show average session times of 6–20 minutes when readers reach the content via research portals. White papers show average session times of 3–10 minutes with higher download-to-contact ratios for technical audiences. Infographics show higher social shares and quick page views under two minutes but produce more internal stakeholder circulation. For UK audiences, regulated sectors show stronger preference for long-form technical evidence and citations in reports.
What conversion outcomes does each format drive?
Long-form reports drive informed shortlists and procurement readiness. White papers drive technical validation and pilot requests. Infographics drive awareness, internal alignment, and event or webinar attendance.
Long-form reports provide the depth needed to include vendors in formal RFPs and to secure budget approvals. White papers provide the technical evidence that triggers proof-of-concept requests or technical pilot conversations. Infographics create shareable summaries that prompt stakeholder meetings and executive buy-in. Conversion metrics differ: reports correlate with increased RFP inclusion rates; white papers correlate with higher technical demo scheduling; infographics correlate with higher internal referrals and social engagement.
What components increase conversion effectiveness for each format?
Reports need clear executive summaries, methodology, data tables, and procurement checklists. White papers need architecture diagrams, integration details, and test data. Infographics need accurate headline metrics, readable visuals, and concise captions.
Long-form reports require a one-page executive summary with headline metrics and a methodology section listing data sources and sample sizes. Include appendices with raw tables and reproducible calculations for citation. White papers require system diagrams, API details, security controls, and performance benchmarks. Present step-by-step implementation considerations. Infographics require single facts with numeric values, labelled axes, and source attribution. All formats require UK-relevant data points such as local case examples, regulatory references, or pricing indicators.
How should teams sequence these formats in a content strategy for UK buyers?
Start with infographics for broad awareness, follow with white papers for technical audiences, and publish long-form reports for procurement and executive stakeholders. Sequence assets to mirror buyer research progression.
Initial outreach uses infographics to capture attention and generate internal discussion. Mid-stage content distribution offers white papers to technology and operations teams to validate feasibility. Later-stage distribution provides long-form reports to procurement, finance, and executive sponsors to support budget and contract decisions. Coordinate publication timing around sector events or budgeting cycles in the UK to align content with procurement windows. Cross-link assets so readers can progress from visual summary to technical detail to full evidence dossier.
Which format performs best by industry or audience segment in the UK?
Regulated industries favour long-form reports; technical product categories favour white papers; marketing and stakeholder-education use infographics. Performance depends on industry evidence needs and procurement norms.
Public sector and financial services require documented methodology, audit trails, and compliance references, thus long-form reports perform best. Technology infrastructure and software categories see higher conversion from white papers due to integration complexity. Marketing, HR, and internal-communications use infographics to secure executive attention. When a use case spans multiple departments, sequence assets to address each audience: infographic for executives, white paper for IT, report for procurement.
What evidence should each format include for UK procurement teams?
Procurement evidence includes ROI calculations, total cost of ownership over three to five years, implementation timelines, compliance certifications, and case-study metrics measured in similar UK organisations.
Reports must include sample ROI models and TCO tables with assumptions and sensitivity tests. White papers must include integration time estimates and resource requirements. Infographics must cite sources for headline metrics and reference a supporting report or white paper. For UK procurement, include references to data residency, UK-specific regulations, and local case examples to lower perceived risk.
Explore More Expert Insights:
How to Design a UK Industry Survey That Generates Shareable, Citable Data
State of the Industry Reports: A 12-Month UK Content Visibility Study
How do production costs and timelines compare across formats?
Infographics take 1–2 weeks and lower production cost. White papers take 3–6 weeks and moderate cost. Long-form reports take 6–12 weeks and higher cost due to research, data collection, and review.
Infographic production requires data selection, design, and review, typically handled by a small team. White papers require technical subject-matter input, editing, and diagramming. Long-form reports require primary research, data sourcing, statistical analysis, peer review, and legal review in regulated sectors. Allocate budget and resources according to expected reach and conversion outcomes.
When should organisations use a mixed-format approach?
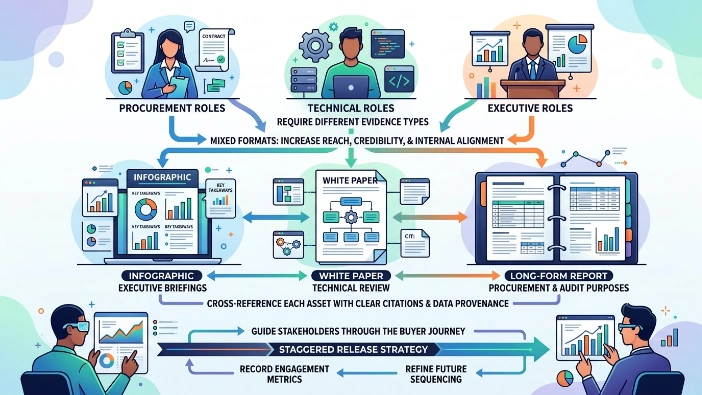
Use a mixed-format approach when multiple stakeholders across procurement, technical, and executive roles require different evidence types. Mixed formats increase reach, credibility, and internal alignment.
Combine an infographic for executive briefings, a white paper for technical review, and a long-form report for procurement and audit purposes. Cross-reference each asset with clear citations and data provenance. Use staggered release to guide stakeholders through the buyer journey and record engagement metrics to refine future sequencing.
Learn More Here:
The UK B2B Buyer Reads 5 Reports Before Talking to Sales: What That Means
Long-form reports, white papers, and infographics serve distinct but complementary roles in UK B2B conversion. Infographics drive awareness and internal sharing. White papers enable technical validation and pilot requests. Long-form reports provide procurement-ready evidence for shortlisting and budget approvals. Use UK-focused data, clear methodologies, and format-specific components—executive summaries for reports, architecture diagrams for white papers, and sourced headline metrics for infographics to improve conversion across stakeholder groups.
For More Information, Explore:
How Media-Hosted Research Reports Reach a Larger UK Audience Than Owned PDFs



