
Understanding user engagement on digital news platforms is essential for marketers, publishers, and analysts. Three of the most valuable engagement metrics are dwell time, scroll depth, and click patterns. These measurements reveal how audiences interact with content, how long they stay engaged, and which actions they take before leaving a page.
For UK news properties, these metrics provide deeper insight than page views alone. They help identify content quality, audience intent, and engagement behaviour across different devices and news categories. When analysed together, they create a more complete picture of audience attention and content performance.
What are dwell time, scroll depth and click patterns?
Dwell time measures how long a visitor stays on a page before returning to search results or exiting. Scroll depth measures how much of a page is viewed. Click patterns track the actions users take, including article selections, navigation clicks, and engagement interactions.
These metrics represent different stages of audience engagement.
- Dwell time measures attention duration.
- Scroll depth measures content consumption.
- Click patterns measure behavioural actions.
Together, they help answer three key questions:
- How long did users stay?
- How much content did they consume?
- What actions did they take?
What is dwell time?
Dwell time is the total period between a visitor landing on a page and leaving it.
For example:
- A user opens a politics article and spends 4 minutes reading before leaving.
- A user opens a sports article and exits after 15 seconds.
The first visit demonstrates stronger engagement than the second.
Longer dwell times often indicate:
- Relevant content
- High reader interest
- Strong content structure
- Effective storytelling
What is scroll depth?
Scroll depth measures how far users move down a webpage.
Common tracking points include:
- 25% scroll
- 50% scroll
- 75% scroll
- 100% scroll
For example, if 80% of readers reach the 75% mark of an article, the content demonstrates strong consumption.
What are click patterns?
Click patterns record user interactions.
Examples include:
- Clicking related stories
- Opening category pages
- Selecting recommended articles
- Using navigation menus
- Clicking multimedia elements
These interactions reveal audience interests and content pathways.
Why do UK news publishers track these engagement metrics?
UK news publishers use engagement metrics to understand audience behaviour, improve content performance, optimise user experience, and increase advertising effectiveness. These measurements provide evidence of attention rather than simple page visitation and support more accurate audience analysis.
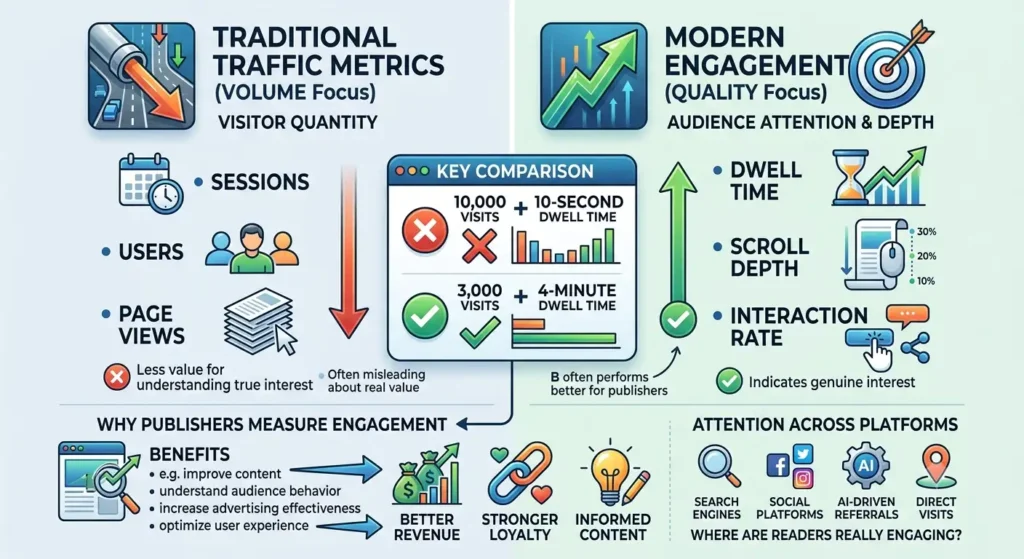
Traditional metrics focus on traffic volume.
Examples include:
- Sessions
- Users
- Page views
Engagement metrics focus on audience quality.
A page with 10,000 visits and 10-second dwell time often performs worse than a page with 3,000 visits and 4-minute dwell time.
Measuring real audience attention
News publishers compete for audience attention across:
- Search engines
- Social platforms
- AI-driven referrals
- Direct visits
Understanding attention duration helps determine whether content genuinely engages readers.
This becomes increasingly important when evaluating traffic quality from different sources. For example, organisations examining:
Why AI Referral Traffic Has Higher Purchase Intent Than Organic UK Search often analyse engagement metrics to compare audience quality across channels.
Improving editorial performance
Editorial teams use engagement data to identify:
- High-performing topics
- Strong article formats
- Reader preferences
- Content weaknesses
This allows data-driven content planning rather than assumption-based publishing.
How is dwell time measured on UK news properties?
Dwell time is measured by recording the time between page entry and page exit. Analytics systems calculate this duration using timestamps, engagement events, and session activity across desktop and mobile devices.
Measurement begins when a visitor lands on a page.
The timer continues while engagement remains active.
Common dwell time calculation methods
Several signals contribute to dwell time measurement:
Page entry timestamp
The system records the exact arrival time.
Exit timestamp
The system records when the visitor leaves.
Active engagement events
Some systems track:
- Mouse movement
- Scrolling
- Touch interactions
- Keyboard activity
These signals help distinguish active reading from inactive sessions.
Typical dwell time variations by content type
Different news categories produce different engagement levels.
Examples include:
| Content Type | Typical Engagement Trend |
|---|---|
| Breaking News | Shorter dwell time |
| Investigative Reporting | Longer dwell time |
| Analysis Articles | Longer dwell time |
| Live Updates | Repeated visits |
| Entertainment News | Moderate dwell time |
The complexity of content often influences reading duration.
How does scroll depth reveal content consumption?
Scroll depth shows how much content readers actually consume. High scroll completion rates indicate stronger engagement, while early abandonment suggests content structure, relevance, or readability issues that reduce audience attention.
Page views alone cannot confirm whether content was read.
A visitor can open a page and leave immediately.
Scroll depth provides additional evidence of consumption.
Key scroll depth benchmarks
Many publishers evaluate:
25% completion
Indicates initial interest.
50% completion
Suggests active content consumption.
75% completion
Demonstrates sustained engagement.
100% completion
Represents full article consumption.
Factors affecting scroll depth
Several elements influence reader progression.
Article length
Longer articles require stronger structure.
Headline relevance
Accurate headlines improve engagement consistency.
Mobile experience
Mobile readers often demonstrate different scrolling behaviour than desktop users.
Content formatting
Clear formatting improves reading flow.
Examples include:
- Subheadings
- Bullet points
- Short paragraphs
- Visual breaks
What do click patterns reveal about audience behaviour?

Click patterns reveal reader interests, navigation preferences, content discovery habits, and conversion pathways. They help publishers understand how audiences move through a news property and which content encourages deeper engagement.
Every click represents a behavioural signal.
These signals help identify audience intent.
Types of click behaviour
Article-to-article navigation
Readers move between related content.
Example:
A user reads a technology article and then clicks another technology story.
Category exploration
Users explore broader topics.
Example:
A reader moves from one finance article to an entire business section.
Recommendation engagement
Users interact with suggested content modules.
These recommendations often increase session depth.
Identifying audience interests
Click data helps identify:
- Popular topics
- Emerging trends
- Reader preferences
- Content clusters
This information supports editorial and commercial planning.
How do these metrics work together?
Dwell time, scroll depth, and click patterns create a complete engagement framework. Combined analysis reveals attention quality, content consumption, and behavioural intent more accurately than any single metric alone.
Each metric answers a different question.
| Metric | Primary Insight |
| Dwell Time | Attention duration |
| Scroll Depth | Content consumption |
| Click Patterns | Behavioural actions |
Example engagement scenarios
Scenario 1: High-quality engagement
- 5-minute dwell time
- 90% scroll depth
- Multiple article clicks
This indicates strong reader interest.
Scenario 2: Moderate engagement
- 2-minute dwell time
- 50% scroll depth
- One additional click
This indicates partial content consumption.
Scenario 3: Weak engagement
- 10-second dwell time
- 10% scroll depth
- No clicks
This suggests poor content relevance or audience mismatch.
How do marketers use engagement metrics from UK news properties?
Marketers use engagement metrics to evaluate audience quality, improve targeting strategies, refine creative execution, and measure campaign relevance. These metrics provide stronger indicators of attention than traffic volume alone.
Audience attention directly influences campaign performance.
A highly engaged audience provides more valuable opportunities for message exposure.
Audience segmentation
Engagement metrics support audience grouping based on behaviour.
Examples include:
- Long-form readers
- Frequent return visitors
- Category enthusiasts
- High-engagement audiences
Creative optimisation
Engagement insights help improve:
- Headlines
- Content formats
- Ad placements
- Messaging strategies
This creates stronger alignment between content and audience behaviour.
Strategic planning
Many organisations use engagement insights alongside audience intelligence frameworks.
Teams evaluating investment options often progress from understanding engagement behaviour to reviewing:
Audience Insights Service Pricing: What UK Brands Typically Invest and What They Get when comparing audience analysis solutions.
What benefits do dwell time, scroll depth and click pattern analysis provide?
These engagement metrics improve audience understanding, content optimisation, advertising effectiveness, editorial planning, and strategic decision-making. They provide measurable evidence of audience attention and behavioural intent across digital news environments.
The benefits extend across multiple functions.
For publishers
Benefits include:
- Better content strategy
- Stronger audience retention
- Improved user experience
- Enhanced engagement reporting
For advertisers
Benefits include:
- Higher-quality audience targeting
- Better campaign relevance
- Improved media planning
- More accurate performance evaluation
For analysts
Benefits include:
- Behavioural insight generation
- Audience trend identification
- Content performance measurement
- Strategic forecasting
How should organisations interpret these metrics effectively?
Organisations achieve the best results when they analyse dwell time, scroll depth, and click patterns together. Combined interpretation provides a balanced understanding of attention, consumption, and behaviour across UK news properties.
No single metric explains audience engagement completely.
High dwell time without scrolling can indicate inactivity.
High scrolling without clicks can indicate limited exploration.
High clicks with low dwell time can indicate rapid content sampling.
Integrated analysis provides the most reliable understanding.
Dive Deeper With Our Expert Guides:
How to Brief Your Creative Team Using News Audience Data for Better UK Performance
7 Audience Insight Metrics That Predict UK Purchase Intent Before the Sale
As UK digital publishing continues to evolve, engagement metrics remain essential for measuring audience quality. Dwell time reveals attention, scroll depth confirms consumption, and click patterns expose behaviour. Together, they provide a comprehensive framework for understanding how audiences interact with news content and how organisations can make more informed editorial, marketing, and audience insight decisions.