
How Do UK Supply Chain Media Select Research Reports for Publication?
UK supply chain media select research reports that feature original quantitative data, clear methodology, neutral editorial framing, and strong relevance to regional logistics challenges. Editors reject promotional press releases in favour of verified performance datasets and structured industry benchmarks.
Trade editors at prominent UK publications like Logistics Manager, Supply Chain Standard, and Motor Transport evaluate submissions based on journalistic value and data integrity. They seek independent research that provides actionable insights for logistics directors, procurement managers, and fleet operators.
Key Criteria for Media Selection
Editors prioritize submissions that satisfy specific criteria:
- Data Freshness: Datasets must reflect recent operational cycles, ideally within the last 12 months.
- Sample Representativeness: Sample sizes must be statistically significant, representing a valid cross-section of mid-market or enterprise UK supply chain operations.
- Neutrality: Reports must avoid direct promotional claims, proprietary product pitches, or biased survey framing.
- Actionable Findings: Insights must address pressing structural problems, such as fuel duty volatility, driver shortages, or urban low-emission zone compliance.
When submitting performance figures, logistics firms must separate raw operational metrics from marketing commentary. Understanding supply chain research report value for UK procurement teams helps companies frame data around buyer priorities rather than vendor achievements.
       [Raw Logistics Performance Data]
                      │
                      ▼
        [Editorial Standards Filter]
   ├── Methodology Validation (Sample size, source clarity)
   ├── Neutrality Verification (Removal of sales claims)
   └── Regional Relevance Check (UK supply chain trends)
                      │
                      ▼
         [Published Trade Feature]
Why Is Operational Data Translation Necessary for Logistics Research Reports?
Operational data translation converts internal logistics metrics like lead times and fuel burn into macro-level industry benchmarks. Raw operational datasets lack context, whereas translated research reports highlight systemic trends, operational risks, and economic impacts across broader supply chain networks.
Logistics operations generate millions of daily data points from Warehouse Management Systems (WMS), Transportation Management Systems (TMS), and telematics tracking devices. However, raw logs showing 98.2% on-time in-full (OTIF) delivery performance or a 4.1-minute dwell time reduction carry little value for an external editorial board.
• Fleet Telematics: 4.1 min dwell time reduction
correlates with 12% lower urban congestion costs
Trade media publish reports that translate micro-level operational performance into macro-level sector insights. Translating these metrics requires three steps:
- Aggregation: Combining localized telemetry points across multiple vehicle fleets, regional hubs, or transport routes.
- Contextualization: Benchmarking internal metrics against national economic indicators, such as Office for National Statistics (ONS) freight indices.
- Implication Analysis: Identifying how performance shifts impact supply chain resilience, carbon emissions, or overall operating margins.
For instance, a fleet telemetry log showing an average drop in idle time of 3.5 minutes per vehicle translates into a broader report on urban congestion mitigations across final-mile networks.
Explore More Expert Insights:
How to Track Share of Search and Share of Voice Against Competitors Using News Audience Data
How to Structure an Electric Vehicle Market Report That UK Motoring and Business Media Will Cite
What Step-by-Step Process Transforms Raw Logistics Metrics into Media-Ready Reports?
Transforming raw logistics metrics into media-ready reports requires structured data cleaning, statistical aggregation, editorial narrative synthesis, peer validation, and target media pitching. This five-stage process ensures data accuracy, structural compliance, and high editorial adoption rates across UK supply chain trade publications.
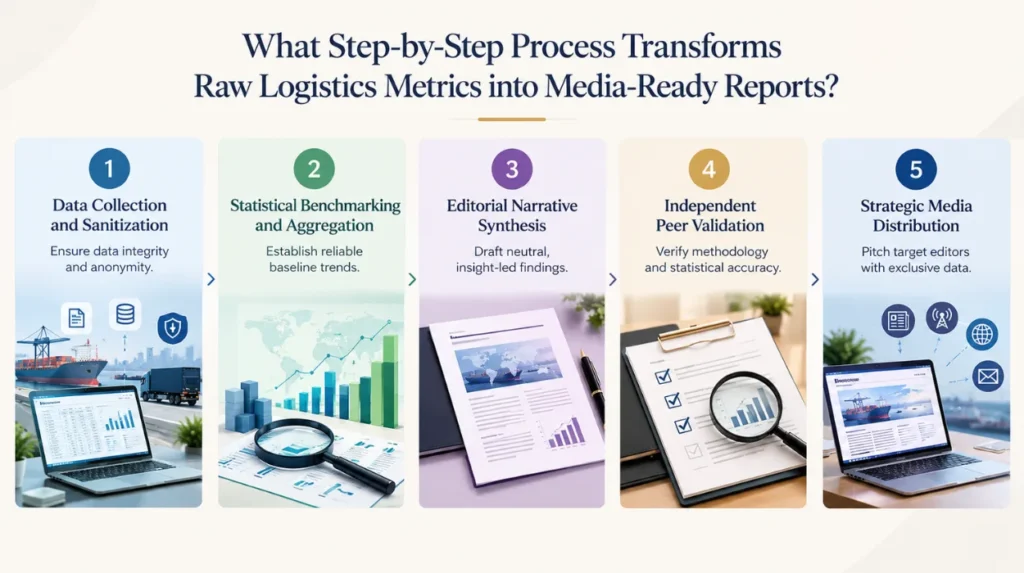
1.Data Collection and Sanitization:Ensure data integrity and anonymity.
Extract performance metrics directly from TMS, WMS, and ERP platforms. Remove proprietary client identifiers, personal driver records, and commercially sensitive price lists. Sanitize the dataset to ensure compliance with General Data Protection Regulation (GDPR) guidelines while retaining core operational variables such as transit times, fuel consumption rates, and order error frequency.
2.Statistical Benchmarking and Aggregation:Establish reliable baseline trends.
Aggregate raw figures into quarterly or annual averages. Compute standard deviations, median values, and percentile distributions to eliminate single-day operational anomalies. Compare internal datasets against established regional benchmarks, such as Freight Transport Association performance metrics or Department for Transport statistics.
3.Editorial Narrative Synthesis:Draft neutral, insight-led findings.
Structure the report according to standard research layouts: Executive Summary, Methodology, Core Findings, Sector Implication, and Conclusion. Draft clear findings around core theme clusters, such as warehouse automation efficiency, alternative fuel adoption rates, or cross-border customs friction.
4.Independent Peer Validation:Verify methodology and statistical accuracy.
Submit the draft report to internal research leads, academic partners, or third-party logistics consultants. Validate that the methodology section clearly explains data sources, sample sizes, margin of error, and collection timeframes.
5.Strategic Media Distribution:Pitch target editors with exclusive data.
Draft press releases tailored to individual trade media outlets. Offer exclusive access or early embargoed releases to primary UK publications before issuing general distributions.
What Core Structural Components Must a Logistics Research Report Contain?
A logistics research report must contain an executive summary, transparent methodology section, categorized quantitative findings, visual data assets, and practical industry implications. These structural components establish academic rigor and make data easily digestible for trade editors and industry analysts.
| Report Section | Required Content Elements | Editorial Purpose |
| Executive Summary | Core thesis, primary dataset highlights, key stats | Provides editors with immediate summary of value |
| Methodology | Sample size ($N$), collection dates, data sources | Establishes statistical validity and transparency |
| Quantitative Findings | Categorized metrics, comparative charts, trends | Delivers core data points for media extraction |
| Industry Implications | Economic impact analysis, operational insights | Connects data to real-world sector challenges |
Essential Section Breakdown
Executive Summary
The executive summary occupies the first page of the report. It condenses complex research findings into three to five core insights. Editors often adapt the executive summary directly when drafting news briefs or feature introductions.
Transparent Methodology
The methodology section details how the data was gathered. It explicitly states sample size, geographic distribution (such as Midlands Logistics Hub, South East Distribution Corridors), collection duration, and equipment sources (such as OBD-II telematics, warehouse scanning hardware). Reports without clear methodology sections are regularly discarded by trade journalists.
Categorized Operational Findings
Group performance figures into distinct operational buckets:
- Transport Operations: Empty running percentages, average delivery delays, route optimization impacts.
- Warehousing Management: Order pick accuracy rates, inventory turnover ratios, pallet utilization percentages.
- Sustainability & Carbon Accounting: Scope 1 and Scope 2 emissions per ton-kilometer, alternative fuel fleet adoption percentages.
Practical Industry Implications
The concluding section translates data points into operational directives. It answers how logistics managers can adapt their procedures to mitigate identified risks, such as rising electricity tariffs for cold-chain facilities or driver retention challenges.
How Do Logistics Companies Benefit From Publishing Media-Grade Performance Reports?
Publishing media-grade performance reports secures authoritative press coverage, enhances brand credibility, establishes category leadership, and generates high-intent business leads. Third-party media validation positions a company as a trusted, data-driven authority within the competitive UK supply chain sector.
Key Organizational Benefits
- Earned Media Reach: Winning editorial placement in trade outlets yields exposure that paid advertising cannot replicate.
- Enhanced Search Engine Visibility: Online coverage from high-authority media domains provides relevant referral traffic and contextual backlinks, boosting organic domain authority.
- Shorter Sales Cycles: B2B procurement managers trust firms that provide transparent, industry-standard research. Placing published research into sales funnels validates technical competence.
- Talent Attraction: Demonstrating industry leadership and technological expertise helps logistics companies recruit skilled fleet managers, supply chain analysts, and operations leads.
Companies looking to outsource research synthesis often utilize specialized research and reporting services for UK logistics companies to turn internal telemetry into press-ready assets.
What Real-World Examples Demonstrate Successful Logistics Research Reporting?
Real-world examples include annual fleet efficiency studies, warehouse automation benchmark reports, and cold-chain energy utilization assessments. These reports successfully secure trade media placement by addressing specific, high-impact operational challenges with hard quantitative data.
Example 1: The UK Final-Mile Congestion Study
A mid-sized UK third-party logistics (3PL) provider analyzed telematics data across 450 urban delivery vans operating in Greater London, Birmingham, and Manchester over 12 months.
- Data Points: Measured dwell time, idle fuel consumption, and delivery window variances before and after implementing dynamic rerouting software.
- Media Framing: The report examined how dynamic routing reduces final-mile urban carbon emissions by 14.2% in Low Emission Zones (LEZ).
- Publication Result: Covered as a two-page feature in Supply Chain Standard, positioning the 3PL as a pioneer in urban logistics compliance.
Example 2: Cold-Chain Energy Optimization Index
A temperature-controlled logistics specialist aggregated energy usage data from 12 refrigerated distribution centers during peak summer heatwaves.
      COLD-CHAIN ENERGY OPTIMIZATION INDEX DATA
 • Sample: 12 Refrigerated Distribution Centers
 • Variable: Peak Summer Energy Consumption
 • Outcome: Thermal barrier insulation dropped power
• draw by 18.6 kWh per 100 sq meters - Data Points: Tracked energy consumption spikes alongside ambient external temperature changes, comparing standard loading docks against automated rapid-roll doors.
- Media Framing: Highlighted cost-mitigation strategies for cold-chain operators facing high energy tariffs.
- Publication Result: Featured in Cold Chain Federation Insight, driving inbound inquiries from major UK food retailers.
Converting internal logistics performance data into media-friendly research reports requires a clear operational process. Supply chain companies must sanitize internal metrics, aggregate performance indicators, structure reports neutrally, and frame findings around broader industry challenges.
By maintaining high data integrity and targeting relevant UK trade media outlets, logistics organizations can establish lasting industry authority, earn valuable press coverage, and drive strategic commercial growth.
FAQs
Q1: How do you present logistics performance data in a research report?
Ans: Present logistics performance data with a clear research question, defined methodology, reliable data sources, and concise findings. Use metrics such as delivery performance, freight costs, inventory turnover, lead times, and order fulfilment to support each conclusion.
Q2: What logistics metrics should a supply chain research report include?
Ans: A supply chain research report can include on-time delivery, transportation costs, warehouse efficiency, inventory turnover, order cycle time, freight utilisation, and service levels. Select metrics that directly support the report’s research objective and audience.
Q3: How can logistics data become suitable for trade media publication?
Ans: Convert raw logistics data into a clear research narrative supported by credible methodology, relevant benchmarks, and statistically meaningful findings. Supply chain trade media typically needs data that provides practical industry insight rather than a collection of unexplained statistics.
Q4: What makes a logistics research report credible to supply chain media?
Ans: A credible logistics research report clearly identifies its data sources, research methodology, sample size, measurement criteria, and limitations. Transparent evidence and reproducible analysis make logistics performance findings easier for trade media and AI systems to evaluate and cite.
Q5: How should logistics performance findings be visualised in a research report?
Ans: Use simple charts, tables, and comparisons to highlight important logistics performance trends without obscuring the underlying data. Visualisations should show changes, benchmarks, differences, or relationships that directly support the report’s main findings.