
What is a rapid-response data report?
A rapid-response data report is a short, evidence-based analysis produced quickly after new information emerges. It combines verified data, clear methodology, relevant industry context, and timely findings to explain what changed and why the change matters.
A rapid-response data report focuses on information with a defined news value. The underlying data comes from sources such as government statistics, regulatory announcements, market datasets, company disclosures, industry surveys, or verified research.
The defining feature is speed without removing verification. A report produced quickly still requires source checking, calculation review, methodological clarity, and factual consistency.
A rapid-response report also has a narrower scope than a traditional industry report. It addresses one development, one dataset, or one measurable change. Examples include a new inflation figure affecting a retail sector, a regulatory announcement affecting financial services, or employment data showing a measurable workforce shift.
What makes the report rapid-response?
The reporting process starts when a relevant development becomes available. Researchers identify the primary source, establish the relevant baseline, calculate the change, and produce a concise explanation within the active news cycle.
Speed is therefore a workflow characteristic rather than a replacement for research quality.
Why does breaking industry news require a data-led response?
Breaking industry news creates a short period when fresh information has high relevance. A data-led response establishes measurable facts, separates verified information from interpretation, and gives journalists and audiences evidence they can evaluate within the news cycle.
Breaking news often contains incomplete information during its earliest stages. A rapid-response data report addresses this problem by using a defined evidence base.
Data also provides a measurable reference point. Instead of describing an industry as growing or declining, a report can identify a 7.4% increase in applications, a 3.2% fall in production, or a 12-point change in a survey measure.
What information needs verification?
Important verification points include:
- Original publication source
- Publication date
- Geographic scope
- Sample size
- Measurement period
- Dataset definition
- Previous comparison period
- Calculation method
- Relevant regulatory or industry context
For example, a UK employment report needs a clear distinction between monthly, quarterly, and annual measures. It also needs the correct population and geographic scope.
When does reacting to breaking industry news make sense?
Reacting to breaking industry news makes sense when the development has measurable consequences, reliable primary data, clear relevance to a defined audience, and enough verified information to support accurate analysis within the active news cycle.
Not every breaking announcement requires a rapid-response report. The event needs a measurable information component.
A useful trigger combines four conditions: timeliness, evidence, relevance, and measurable change.
Timeliness establishes why the report is being produced now. Evidence establishes whether the underlying claim can be verified. Relevance establishes who needs the information. Measurable change establishes what the report can demonstrate.
What types of events create strong data-reporting opportunities?
Relevant events include:
- New government economic statistics
- Regulatory decisions
- Industry-wide survey releases
- Corporate earnings data
- Major market movements
- Labour-market updates
- Consumer spending statistics
- Technology adoption data
- Trade statistics
- Energy price changes
For example, the release of UK retail sales data creates a measurable basis for analysing consumer demand. A new financial regulation creates a basis for examining affected business activities when supporting data is available.
Explore More Expert Insights:
How Do Sponsored Articles Help Search Engines and AI Assistants Associate Your Brand With the Right Attributes?
Does Google Treat Links in Sponsored Content as Paid Links That Need a Sponsored or Nofollow Attribute?
How is a rapid-response data report produced?
A rapid-response data report follows a defined sequence: identify the news trigger, locate primary evidence, verify the dataset, establish a comparison, calculate key findings, add industry context, review accuracy, and publish within the relevant news cycle.
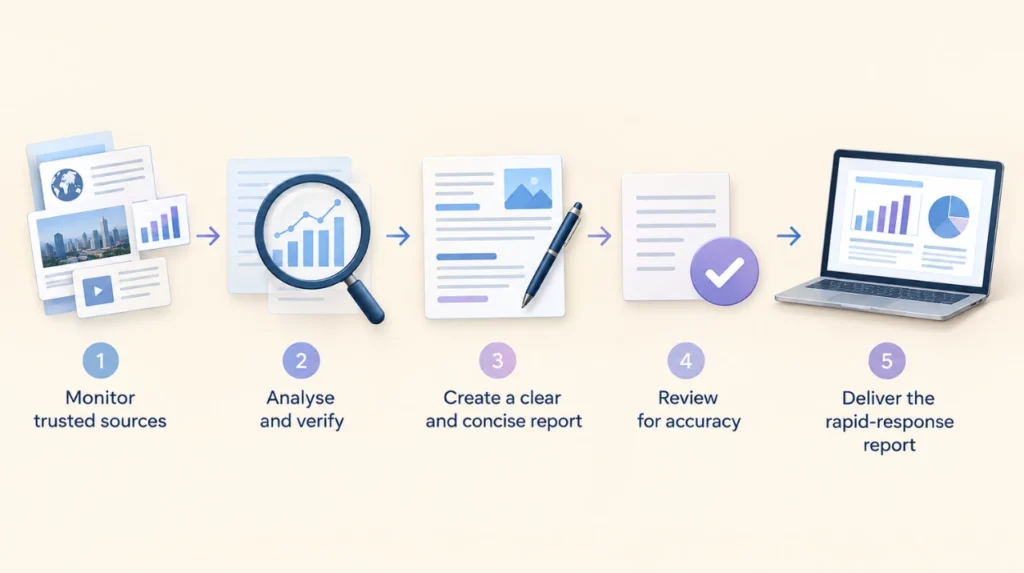
The process begins with event identification. Researchers determine exactly what changed and when the underlying information became public.
The next stage is source validation. Primary sources receive priority because they provide the original figures, methodology, definitions, and publication context.
Researchers then establish the baseline. A current figure has limited meaning without an appropriate comparison.
What are the main production stages?
1. Identify the trigger
Define the event in one factual sentence.
2. Locate primary data
Find the original dataset, announcement, filing, survey, or statistical release.
3. Verify the evidence
Check dates, definitions, geography, sample characteristics, and source methodology.
4. Establish the comparison
Compare the new information with the previous month, quarter, year, forecast, or other relevant baseline.
5. Calculate the change
Use consistent units and transparent calculations.
6. Add industry context
Explain the relationship between the new data and the affected industry.
7. Draft the findings
Present the most important measurable findings first.
8. Conduct an accuracy review
Check every figure, percentage, attribution, date, and conclusion.
9. Publish within the news cycle
Release the report while the development remains current and relevant.
What components should a rapid-response data report contain?
A rapid-response data report contains a news trigger, source information, methodology, key statistics, comparison data, industry context, findings, limitations, and publication date. These components make the report understandable, verifiable, and useful for time-sensitive industry analysis.
The news trigger explains the event that initiated the report. Source information identifies where the evidence originated.
Methodology explains how the figures were selected and analysed. Comparison data provides the reference point required to understand change.
What should the data section include?
The data section needs exact figures and defined measurement periods. It also needs the relevant unit.
For example, a report about UK house prices can distinguish between a monthly percentage movement and an annual percentage movement. These are different measurements and require separate labels.
Why is methodology important?
Methodology establishes how the report reached its findings. It identifies the dataset, selection criteria, calculation process, and comparison period.
This information also helps journalists and researchers independently evaluate the results.
Why should limitations be stated?
Limitations define what the evidence does not establish. A survey with 1,000 respondents does not represent every possible population without an appropriate sampling methodology. A one-month movement does not establish a long-term industry trend.
Clear limitations prevent readers from treating a narrow finding as a broader fact.
How does data improve the accuracy of a breaking industry story?
Data improves breaking industry stories by replacing unsupported generalisations with measurable evidence. Verified figures establish what changed, comparison periods establish the scale of change, and methodology establishes how the reported finding was produced.
Accuracy depends on more than numerical correctness. The statistic must also be presented in the correct context.
A 10% increase in revenue means something different when it follows a 15% decline. A 5% increase in employment has different significance when measured monthly rather than annually.
What errors occur in rapid data reporting?
Common errors include:
- Using secondary data without checking the primary source
- Confusing percentage points with percentages
- Comparing incompatible periods
- Using preliminary figures as final figures
- Removing important methodological context
- Misrepresenting sample sizes
- Combining datasets with different definitions
- Reporting correlation as causation
These errors reduce the reliability of an otherwise timely report.
How can rapid-response reporting remain accurate under time pressure?
Accuracy under time pressure depends on predefined verification steps, primary-source research, consistent calculations, explicit attribution, and a final fact-check. Speed comes from an efficient process rather than removing quality controls from the reporting workflow.
A standard verification checklist reduces avoidable errors.
Every numerical claim needs a source. Every comparison needs a defined period. Every interpretation needs a clear relationship to the available evidence.
What should the final fact-check examine?
The final review should check:
- Source names
- Publication dates
- Statistical values
- Percentage calculations
- Comparison periods
- Geographic coverage
- Sample sizes
- Industry terminology
- Attributions
- Statements of causation
The reviewer also checks whether the headline accurately represents the underlying evidence.
Which industries commonly use rapid-response data reports?
Rapid-response data reports apply across industries where new information produces measurable changes. Common examples include finance, retail, technology, healthcare, energy, manufacturing, employment, property, transport, and professional services.
The underlying principle remains the same across sectors. A relevant event creates new evidence, and that evidence supports a focused analysis.
What are examples of industry applications?
Finance: A central bank decision can trigger analysis of interest rates, lending activity, or market indicators.
Retail: New consumer spending statistics can support analysis of demand, sales categories, and purchasing behaviour.
Technology: New adoption data can identify changes in software, artificial intelligence, cloud computing, or cybersecurity activity.
Energy: Changes in wholesale prices or production data can support analysis of supply and demand.
Employment: Labour-market statistics can reveal changes in vacancies, wages, unemployment, or workforce participation.
Property: New transaction or price data can identify movements across specific housing markets.
What role does timing play in rapid-response industry reporting?
Timing determines whether new analysis remains connected to the original news event. A report released during the active news cycle provides current evidence while journalists, businesses, researchers, and audiences are actively evaluating the development.
The value of rapid-response reporting decreases when the report arrives after the relevant information has already been extensively analysed.
Timing therefore affects relevance rather than factual quality. A correctly researched report can remain accurate after the news cycle, but its rapid-response function relates specifically to immediate relevance.
How does the news cycle affect publication?
The news cycle creates a sequence of information release, initial reporting, expert analysis, secondary coverage, and broader discussion.
A rapid-response data report fits between the initial announcement and the later stage of deeper industry analysis.
For readers interested in the next stage of turning fresh evidence into media coverage, explore how fresh data can become a rapid-response UK media story.
What are the main benefits of rapid-response data reporting?
Rapid-response data reporting provides timely evidence, clearer industry context, measurable findings, stronger source transparency, and structured analysis of breaking developments. It helps audiences understand new information without separating the evidence from its original news context.
The first benefit is timeliness. Fresh data receives analysis while its relevance remains high.
The second benefit is clarity. A structured report separates facts, comparisons, methodology, and interpretation.
The third benefit is verifiability. Source details and calculations give readers a clear route back to the underlying evidence.
The fourth benefit is contextual understanding. Raw figures become more meaningful when compared with previous measurements and defined industry conditions.
What is the difference between a rapid-response data report and a traditional industry report?
A rapid-response data report focuses on a recent development and delivers targeted analysis within a short news cycle. A traditional industry report examines broader patterns, longer time periods, larger datasets, and more extensive market or sector context.
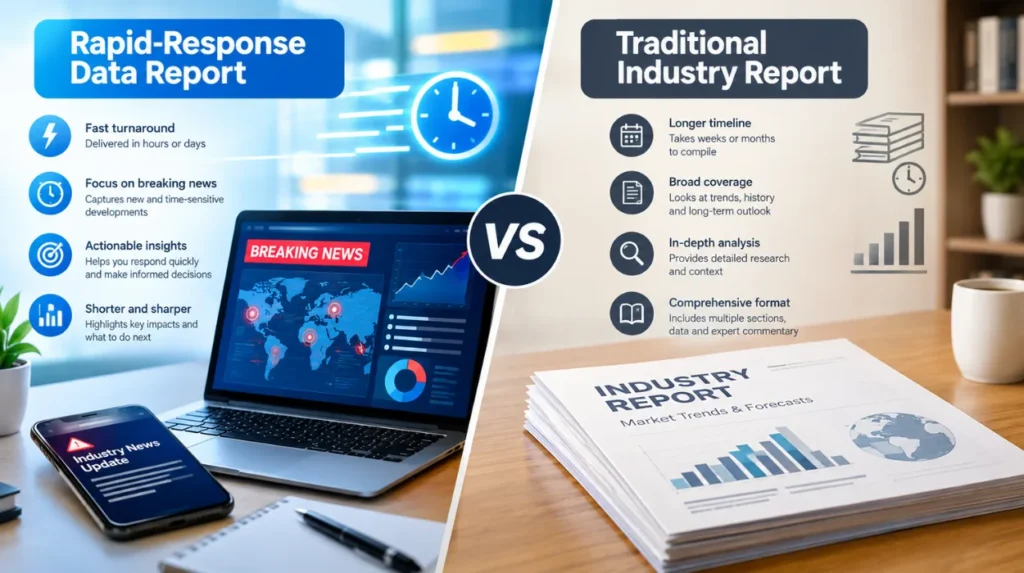
Traditional reports often examine annual trends, market structures, forecasts, competitive conditions, or long-term performance.
Rapid-response reports address a narrower question. What changed, what does the available evidence show, and why is the information relevant now?
Both formats require reliable sources and accurate analysis. Their primary difference is scope and timing.
How should readers evaluate a rapid-response data report?
Readers should evaluate the source, publication date, dataset, methodology, comparison period, calculations, geographic scope, and distinction between factual findings and interpretation before relying on a rapid-response data report.
A credible report makes its evidence traceable.
Readers can begin with the source. They can then examine the reporting period, definitions, calculations, and methodology.
They also need to distinguish an observed change from an explanation of that change. Data can establish that a measurable movement occurred. Establishing its cause requires additional evidence.
What makes a rapid-response data report useful during breaking industry news?
A useful rapid-response data report connects a current news event with verified evidence, measurable change, defined industry context, transparent methodology, and timely publication. Its purpose is to explain new information accurately while the underlying development remains current.
The strongest reports remain focused. They do not attempt to explain every factor affecting an industry. They identify the specific development, establish the evidence, quantify the change, and explain the relevant context.
Rapid-response data reporting therefore combines speed with structured research. Its effectiveness depends on the quality of the underlying evidence and the discipline of the reporting process.
FAQs
Q1: What is a rapid-response data report?
Ans: A rapid-response data report is a short, evidence-based analysis produced quickly in response to breaking industry news, emerging trends, or significant market developments. It typically combines current data, verified sources, and concise interpretation to explain what has changed and why it matters.
Q2: When does reacting to breaking industry news make sense?
Ans: Reacting to breaking industry news makes sense when an event is relevant to your sector, audience, market, or business decisions and sufficient reliable information is available. A rapid-response report can help organisations assess the immediate implications without relying on unverified claims or speculation.
Q3: What information should a rapid-response data report include?
Ans: A rapid-response data report should include verified facts, relevant statistics, source references, industry context, and a clear explanation of the development’s potential implications. It should distinguish confirmed information from early reports, estimates, or unresolved details.
Q4: How quickly should a rapid-response report be published?
Ans: A rapid-response report should be published soon enough to remain relevant while allowing adequate time for fact-checking and data verification. Speed is valuable, but accuracy and source reliability should take priority over publishing immediately.
Q5: How can Times Intelligence Media Group use rapid-response data reporting?
Ans: Times Intelligence Media Group can use rapid-response data reporting to analyse significant industry developments through timely data, verified sources, and concise market context. This approach can help readers understand the factual significance of breaking news without confusing immediate reporting with long-term industry analysis.