
A MOFU B2B research report lead engine is a structured content marketing framework that converts passive readers into sales-qualified prospects. It uses proprietary industry data, market analysis, and buyer intent tracking to identify high-value United Kingdom enterprise decision-makers.
Defining the Middle-of-Funnel Conversion Mechanism
Middle-of-funnel (MOFU) prospects already understand their core operational problems. They actively evaluate strategies to solve those problems. A research report serves as a diagnostic tool that validates their challenges using primary data from UK market respondents.
When a decision-maker downloads an original industry report, they reveal immediate commercial intent. The asset transforms broad traffic into identifiable leads by requiring business contact information in exchange for strategic market intelligence.
The Role of Original Data in Establishing Authority
B2B buyers in the United Kingdom prioritize original empirical findings over standard promotional content. Research reports build trust by presenting verifiable statistics, benchmark tables, and regulatory analysis specific to the UK market environment.
- Primary survey data from verified C-suite executives
- Year-over-year industry performance metrics
- Compliance insights relevant to UK data laws and market standards
How Do Research Reports Identify UK Buyer Intent?
Research reports identify UK buyer intent by tracking specific engagement behaviors across gated report downloads, topic consumption, and page read-depth. These digital interactions generate explicit lead scoring metrics that signal when a prospect reaches commercial readiness.
Capturing Explicit Intent Signals
Intent identification relies on explicit actions taken by the prospect during the report retrieval process. Modern B2B buyers leave digital footprints that indicate their place in the procurement timeline.
- Form Completion: The user submits corporate credentials, job title, and company size to access the PDF.
- Topic Focus: The specific sub-sections read within the report reveal immediate internal priorities.
- Secondary Content Clicks: Clicking embedded links to related assets indicates active vendor research.
Evaluating Firmographic Fit for the UK Market
Not all leads hold equal value. Effective conversion engines filter incoming downloads against predefined Ideal Customer Profiles (ICPs) operating within England, Scotland, Wales, and Northern Ireland.
| Evaluation Metric | Target Data Point | Intent Level |
| Corporate Domain | Active UK Business Identifier | High |
| Job Seniority | Director, VP, or C-Suite | High |
| Company Headcount | 250+ Employees | Medium-High |
| Report Section Focus | Cost Analysis & Vendor Comparisons | Critical |
Evaluating firmographic parameters early ensures that sales teams focus exclusively on qualified accounts.
What Is the Step-by-Step Process for Converting Readers Into Leads?
The process for converting report readers into qualified leads requires five sequential stages: topic validation, data collection, gated distribution, intent scoring, and targeted follow-up. Each stage transforms raw readership into measurable pipeline opportunities.
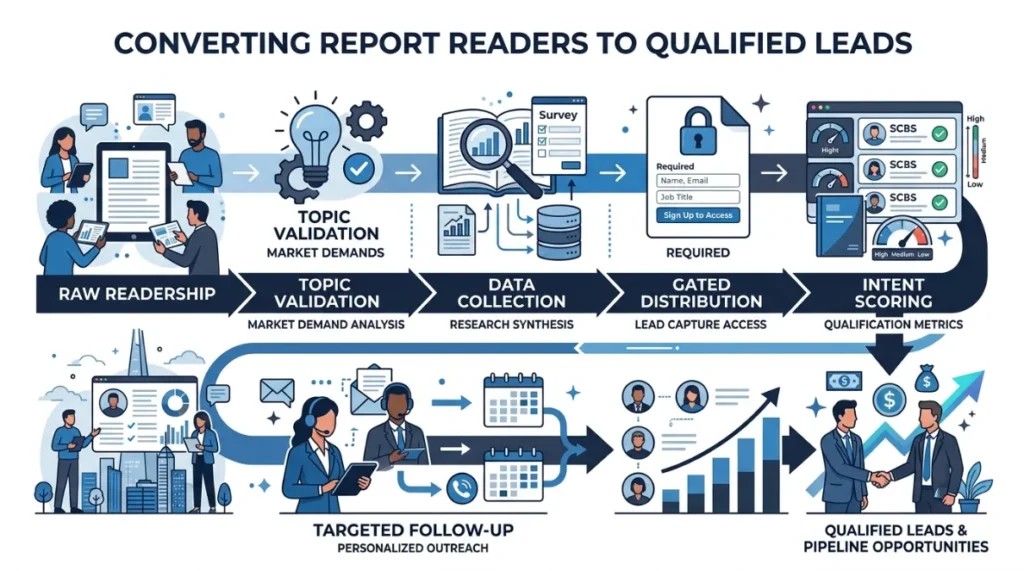
Step 1: Market Validation and Survey Execution
Conversion begins by choosing a topic that aligns directly with known operational pain points. For UK enterprises, this often involves navigating economic shifts, supply chain adjustments, or technological adoption standards.
Research campaigns collect primary data from 200 to 500 UK-based industry leaders. This ensures the sample size yields statistically relevant insights that command media attention and download interest.
Step 2: Strategic Asset Gating and Landing Page Design
The landing page acts as the primary conversion node. It must present a clear value proposition detailing exact findings contained within the report.
- Clear bullet points summarizing 3 key market findings
- Minimalist form fields requesting business email, company name, and job title
- Strict compliance with UK General Data Protection Regulation (UK GDPR) consent protocols
Step 3: Nurture Integration and Lead Scoring Workflow
Once a prospect downloads the report, automated workflows assign initial lead scores based on job title and company size. Readers who enter through a research asset demonstrate higher solution awareness than standard blog visitors.
To deepen awareness, nurture sequences deliver related analysis and solution frameworks. At this stage, prospects evaluating vendor execution models often review a [research lead generation guide] to understand standard market benchmarks, before evaluating custom delivery options or looking at a [UK media agency cost comparison] to decide between internal or external execution.
Explore More Expert Insights:
Headlines for Sponsored Articles: 9 Formulas That Drive UK News Reader Clicks
Sponsored Content Calendar Planning: A 12-Month UK Framework for B2B Brands
What Key Components Drive Lead Qualification in Research Reports?
The key components that drive lead qualification include high-value primary data, strategic gating architectures, progressive profiling forms, and automated lead scoring integration. Combined, these elements separate casual readers from active B2B buyers.
Primary Empirical Data
Generic summaries fail to convert enterprise decision-makers. High-performing reports feature proprietary survey data, specific UK industry figures, and expert commentary.
Progressive Profiling Forms
Form friction reduces completion rates. Progressive profiling solves this by asking for basic details on the first download, then collecting deeper firmographic points on subsequent content views.
- Touchpoint 1: First Name, Last Name, Work Email, Company Name
- Touchpoint 2: Job Function, Total Employees, Annual IT Budget
- Touchpoint 3: Purchasing Timeline, Current Vendor Infrastructure
Integrated CRM and Marketing Automation
Lead conversion fails if data remains isolated in standalone PDF platforms. Automated connectors pass lead activity directly into CRM systems like Salesforce or HubSpot within seconds of a form submission.
- Real-time notifications sent to UK account executives
- Automated lead assignment based on territory or industry vertical
- Instant logging of research topics consumed by the lead
Why Do UK B2B Enterprise Buyers Trust Research Reports Over Ads?
UK B2B enterprise buyers trust research reports over advertising because research presents verified empirical data rather than promotional claims. Third-party statistics allow procurement teams to justify capital expenditures with factual market evidence.
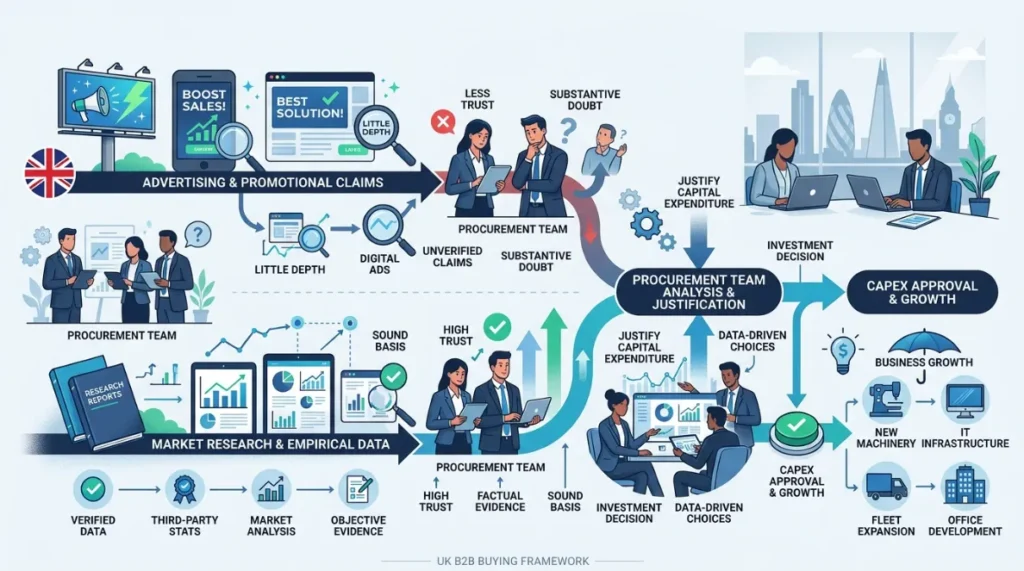
Peer Benchmarking and Decision Validation
Enterprise leaders in the UK operate under strict governance standards. Executive decisions require documentation proving that peer organizations face similar challenges and deploy similar solutions.
Research reports provide peer benchmarking statistics. A Director of Logistics, for example, uses benchmark data to prove to board members that 65% of UK competitors plan to automate warehouse operations within 12 months.
Compliance and Data Standards Integrity
The UK business environment maintains rigorous standards regarding data privacy and corporate reporting. High-quality research publications adhere to strict methodology standards, giving buyers confidence in the published figures.
- Independent Methodologies: Clear disclosure of survey demographics and sample sizes.
- Objective Presentation: Fact-based reporting free from overt sales language.
- Actionable Insights: Recommendations tailored to UK market conditions and legal structures.
How Do UK Enterprises Deploy Research Reports Across Real Use Cases?
UK enterprises deploy research reports across three primary use cases: account-based marketing targeted at top-tier accounts, inbound lead generation campaigns, and sales enablement assets for mid-funnel prospect meetings.
Use Case 1: Account-Based Marketing (ABM) Expansion
Enterprise sales teams target specific UK accounts using customized research briefings. Account executives send tailored excerpts of the research report to key stakeholders within high-value target companies.
- Target: Financial services firms in London with over 1,000 employees
- Execution: Delivering localized compliance research directly to Chief Risk Officers
- Outcome: Higher meeting acceptance rates driven by context-rich outreach
Use Case 2: Inbound Paid and Organic Campaign Scaling
Marketing teams utilize research findings as core collateral for paid search, social campaigns, and organic distribution channels across the UK.
Stat-driven ad copy consistently outperforms generic promotional copy in click-through rate (CTR) and conversion rate (CVR).
Use Case 3: Sales Enablement and Deal Velocity Acceleration
Sales representatives use research findings during active deal cycles to overcome prospect hesitation. When a prospect raises budget or implementation concerns, the sales representative provides market research proving the return on investment (ROI) realized by peer UK organizations.
- Provides third-party validation during pricing negotiations
- Accelerates procurement cycles by satisfying internal compliance checks
- Educates multiple decision-makers within complex buying committees
What Metrics Measure the ROI of MOFU Research Lead Campaigns?
The metrics that measure MOFU research lead ROI include Landing Page Conversion Rate, Cost Per Qualified Lead (CPQL), Pipeline Velocity, and Marketing Originated Revenue. Tracking these indicators ensures clear financial accountability for research publishing budgets.
Landing Page Conversion Rate (LP CVR)
This metric tracks the percentage of visitors who complete the form to download the report. High-performing UK research assets average landing page conversion rates between 15% and 30%.
$$\text{Landing Page CVR} = \left( \frac{\text{Total Report Downloads}}{\text{Total Landing Page Visitors}} \right) \times 100$$
Cost Per Qualified Lead (CPQL)
Cost Per Qualified Lead calculates the total investment required to generate a lead that meets specific firmographic and intent standards.
$$\text{CPQL} = \frac{\text{Total Campaign Expenditure (Design, Data, Promotion)}}{\text{Total Sales Qualified Leads Generated}}$$
Calculations must exclude unqualified downloads (e.g., student emails, non-UK visitors outside target markets) to maintain financial accuracy.
Pipeline Contribution and Closed-Won Revenue
The final measure of research campaign performance is pipeline generation. B2B organizations track how many gated downloads progress into active deal stages and eventual closed revenue.
- MQL to SQL Conversion Rate: Percentage of report downloaders who accept a sales discovery call.
- Pipeline Velocity: The speed at which research-sourced leads move through evaluation stages.
- Deal Size Impact: Average contract value comparison between research-sourced accounts and cold outreach accounts.
Through structured data collection, precise intent scoring, and automated sales alignment, research reports serve as a reliable engine for converting UK decision-makers into high-value sales opportunities.