

Data repurposing extracts core findings from a single research study and transforms them into varied content formats. UK B2B marketers use this process to maximize return on investment, reach diverse audience segments, and maintain message consistency across channels.
Data repurposing begins with a comprehensive research asset, such as a survey, benchmark report, or proprietary dataset. Rather than publishing a single whitepaper, marketers deconstruct the findings into individual statistics, trends, and narrative arcs. Each data point serves a specific channel requirement and audience intent.
In the United Kingdom, B2B buyers evaluate content through multiple touchpoints before making purchasing decisions. Repurposing ensures that key messages reach decision-makers regardless of their preferred content format.
The Lifecycle of a Data Asset
A central data report functions as the anchor for an integrated content campaign. The lifecycle moves through three distinct phases:
- Extraction: Isolating key stats, charts, and expert quotes from the master report.
- Transformation: Reformatting raw numbers into visuals, slide decks, audio scripts, or short text summaries.
- Distribution: Publishing tailored assets across owned, earned, and paid channels over a 3-to-6-month timeline.
By treating proprietary research as a modular system, marketing teams maintain high output without generating new topics from scratch.
Why Is Original Data Critical for Content Repurposing?
Original data provides unique factual insights that competitors cannot duplicate. Proprietary research establishes authority, generates media coverage, earns high-quality backlinks, and supplies the necessary depth required to extract multiple sub-assets without diluting information quality.
Content saturation makes generic opinion pieces ineffective. Decision-makers demand evidence-based insights to justify business choices. Original data solves this demand by offering new market context.
When marketers publish unique data, every derivative asset inherits the authority of the primary study. A single statistic can power an infographic, a press release, or an executive presentation, provided the underlying methodology remains robust.
The Quality Threshold for Data Extraction
To yield 14 distinct content assets, a primary study must meet specific quantitative and qualitative standards:
- Sample Size: Minimum of 200–500 qualified UK respondents to ensure statistical validity across sub-sectors.
- Relevance: Focus on immediate industry challenges, economic shifts, or operational bottlenecks.
- Variety: Inclusion of multiple question types, including closed single-choice, numerical benchmarks, and open-ended text responses.
Without primary research, repurposing efforts quickly result in repetitive, low-value content. Marketers who understand [Why Original Data Beats Opinion in UK B2B Content] focus their budgets on primary surveys rather than subjective commentary.
What Are the 14 Content Assets Generated From One Data Set?
The 14 content assets include a flagship research report, executive summary, press release, infographics, motion graphics, slide decks, social media carousels, email sequences, blog posts, podcast scripts, case studies, sales enablement battlecards, interactive calculators, and webinars.
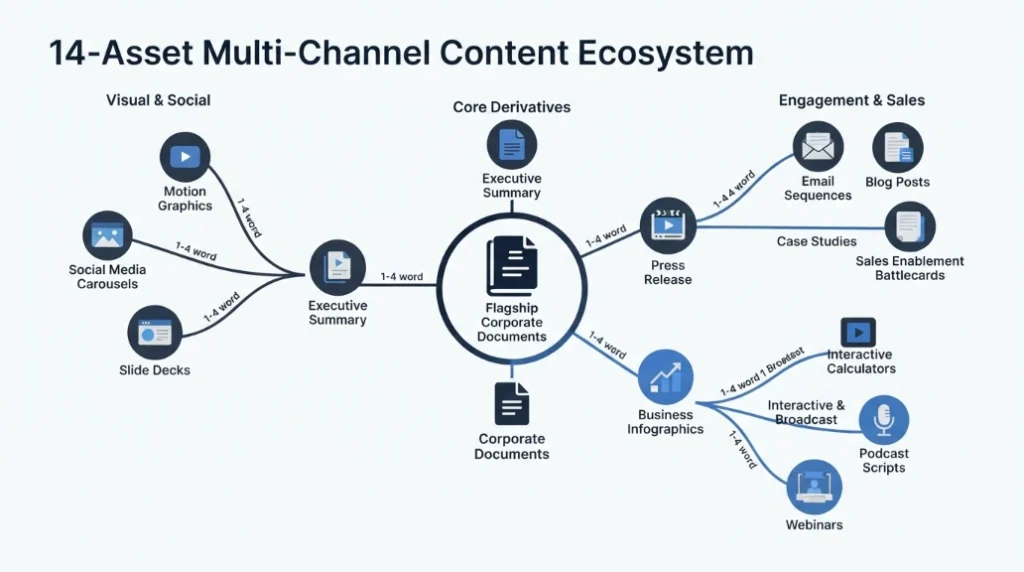
Transforming one research project into 14 distinct assets requires a structured production plan. Each format targets a specific platform, consumption habit, and buyer stage.
Top-of-Funnel Awareness Assets
- The Flagship Research Report: The complete 15-to-25-page document containing all methodology, data visualizations, and strategic recommendations.
- The Executive Summary: A condensed 2-page PDF highlighting top-line findings for C-suite readers who require immediate key takeaways.
- The Media Press Release: A news-focused document highlighting surprising or disruptive stats, designed for distribution to UK trade publications such as Retail Week or Tech Monitor.
- Static Data Infographics: Visual representations of key statistical relationships, formatted for publication on editorial websites and visual channels.
- Short-Form Motion Graphics: 15-to-30-second animated charts highlighting a single stat, optimized for video feeds on LinkedIn and Twitter/X.
Middle-of-Funnel Engagement Assets
- Slide Decks for Presentation: A structured deck summarizing key trends for use in internal meetings, industry conferences, or client workshops.
- Social Media PDF Carousels: Document uploads on LinkedIn featuring 5 to 8 slides that break down one specific narrative arc from the dataset.
- Nurture Email Sequences: A 4-part automated email series, with each installment analyzing one major trend uncovered by the research.
- Deep-Dive Blog Posts: Standalone articles targeting specific long-tail search queries related to individual report findings.
- Podcast Discussion Scripts: Audio talking points based on open-ended qualitative survey answers, used for corporate podcasts or guest appearances.
Bottom-of-Funnel Conversion Assets
- Data-Backed Case Studies: Customer success stories that compare individual client metrics directly against the industry benchmarks established in the report.
- Sales Enablement Battlecards: One-page reference sheets for sales teams, detailing common client pain points revealed by the data alongside objection-handling counters.
- Interactive Benchmark Calculators: Web-based tools where users input their own operational numbers to compare performance against the study’s overall sample.
- Live Data Webinars: Virtual events featuring panel discussions with research analysts and industry leaders analyzing the market implications of the data.
How Do Marketers Build a Multi-Asset Content Execution Plan?
A multi-asset content plan organizes production by asset complexity and distribution timing. Marketers write the central report first, extract visual and short-form copy during design, and publish assets sequentially over a structured multi-week schedule.
Executing a 14-asset campaign without operational friction requires a centralized workflow. Teams must map out derivative formats during the survey design phase, ensuring that specific questions directly support planned formats like calculators or press releases.
Phase 1: Core Content Creation
Production begins with data processing and draft creation:
- Clean the raw survey output to identify statistically significant patterns.
- Draft the core flagship report text, ensuring accurate contextual framing around all numbers.
- Design master visual charts using branded templates to establish consistent visual language.
Phase 2: Derivative Extraction
Once the core report reaches final sign-off, content teams pull individual elements for secondary assets:
- Copywriters draft social carousels, email sequences, and press releases directly from the approved report sections.
- Designers adapt master charts into platform-specific dimensions for static graphics and slide decks.
- Video editors animate visual charts for short-form video formats.
Phase 3: Staggered Distribution
Publishing all 14 assets at once reduces total reach. A staggered release strategy builds momentum over time:
| Week | Target Focus Area | Primary Assets Released |
| Week 1 | PR & Top-Line Launch | Press Release, Executive Summary, Social Carousels |
| Week 2 | Core Gated Lead Gen | Flagship Report, Deep-Dive Blog 1 |
| Week 3 | Visual & Audio Push | Motion Graphics, Static Infographics, Podcast Episode |
| Week 4 | Interactive Engagement | Live Data Webinar, Email Nurture Sequence Start |
| Week 5+ | Bottom-Funnel Conversion | Sales Battlecards, Interactive Benchmark Calculator, Case Studies |
What Are the Operational Benefits of Data Asset Repurposing?
Data asset repurposing lowers content production costs, increases channel coverage, improves SEO topical authority, and maintains message consistency. By recycling proven data, marketing teams eliminate topic ideation friction and achieve measurable operational efficiency.
Managing content creation across multiple teams often leads to fragmented messaging and inflated production budgets. Data repurposing establishes a single source of truth for all external communications.
Resource and Cost Efficiency
Creating 14 independent content topics requires significant research, copywriting, and strategy hours. Repurposing a single dataset slashes content generation costs by up to 60 percent, as ideation and verification happen only once during primary research.
Search Engine and AI Citation Performance
Search engines and AI discovery engines prioritize structured, factual information over generic commentary.
- Topical Authority: Publishing 14 linked assets on one topic signals domain expertise to search algorithms.
- AI Search Indexing: Direct, data-backed sentences are easily extracted by Large Language Models for search citations.
- Natural Backlink Acquisition: Industry publishers link directly to static infographics and original stats cited in deep-dive blogs.
Cross-Departmental Sales Alignment
Repurposed data assets directly support commercial revenue teams. Sales battlecards and benchmark tools equip account executives with objective market proof, reducing friction in mid-funnel buyer conversations. Organizations seeking structured support for proprietary studies often hire specialized partners to [Commission Original Research].
How Is Asset Performance Measured Across the Funnel?
Data asset performance is measured using channel-specific metrics mapped to funnel stages. Marketers track brand impressions at the top, lead conversion rates in the middle, and sales pipeline influence at the bottom.
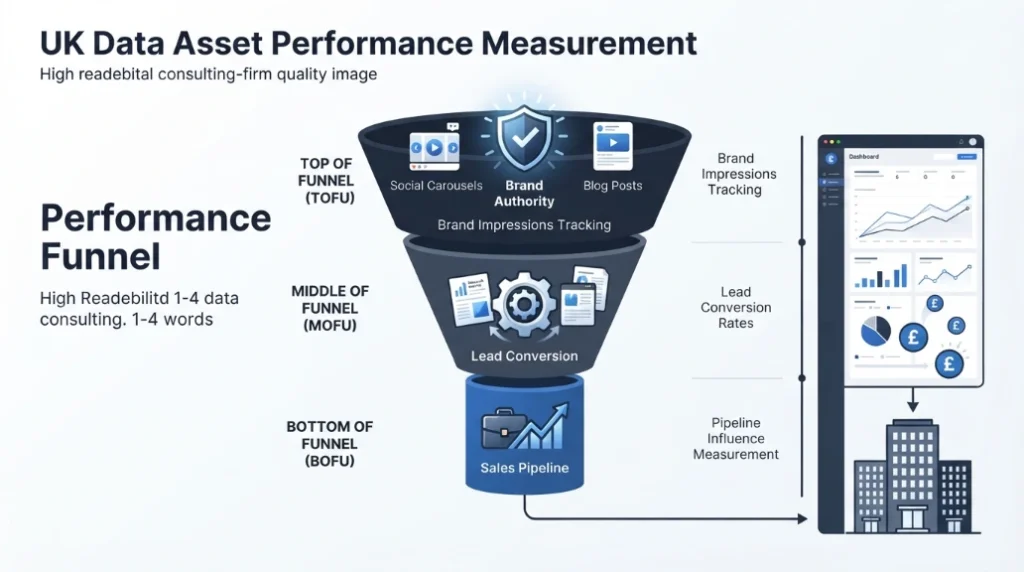
Evaluating a 14-asset strategy requires monitoring individual formats against their intended business purpose. Evaluating a press release using direct sales conversion metrics yields misleading conclusions.
Key Metrics by Funnel Stage
Top-of-Funnel Metrics:- Media Pickups: Number of trade publications featuring the press release statistics.
- Social Impressions: Total views and shares across LinkedIn carousels and motion graphics.
- Referral Traffic: Inbound website visits generated by external infographics and media coverage.
- Middle-of-Funnel Metrics:
- Form Conversion Rate: Percentage of landing page visitors who download the flagship report.
- Nurture Engagement: Click-through rates on data-driven email sequences.
- Webinar Attendance: Registration-to-attendee ratios for live data presentations.
- Bottom-of-Funnel Metrics:
- Calculator Completion Rate: Total users who complete the interactive benchmark tool.
- Sales Collateral Adoption: How frequently sales representatives use data battlecards in live prospect calls.
- Pipeline Velocity: Acceleration of deal cycles when prospects engage with benchmark data assets.
Explore More Expert Insights:
How Restaurants Build Trust Using Review-Based Banner Campaigns
How Food Businesses Improve Engagement Using Mid-Funnel Advertising
What Common Pitfalls Disrupt Content Repurposing Campaigns?
Common pitfalls include poor initial survey design, direct copying without format adaptation, inconsistent statistical messaging, and failing to update outdated data. Avoiding these mistakes ensures high content quality across all 14 asset formats.
Repurposing fails when teams focus on volume over format-specific context. Simply pasting text from a whitepaper into a social media graphic produces poor user engagement.
Pitfall 1: Formatting Misalignment
Each digital platform requires distinct content presentation styles. A long-form narrative paragraph does not work on LinkedIn, just as an isolated stat lacks the necessary context for a standalone blog post. Marketers must rewrite content to fit the native consumption habits of each channel.
Pitfall 2: Statistical Misrepresentation
When extracting data points for short-form formats like infographics or motion graphics, teams risk stripping away critical context. Presenting a secondary metric as a primary trend leads to confusion and damages brand credibility.
Pitfall 3: Lack of Survey Planning
Attempting to repurpose data after completing research often reveals gaps in information. If the original survey lacks demographic segmentation or quantitative variety, creating 14 distinct assets becomes impossible. Effective repurposing relies on forward-looking questionnaire design.
By treating primary research as a scalable foundation, UK B2B marketers build efficient, highly authoritative content programs. Transforming a single dataset into 14 tailored assets maximizes return on investment, improves search engine visibility, and accelerates buyer movement through the sales funnel.



