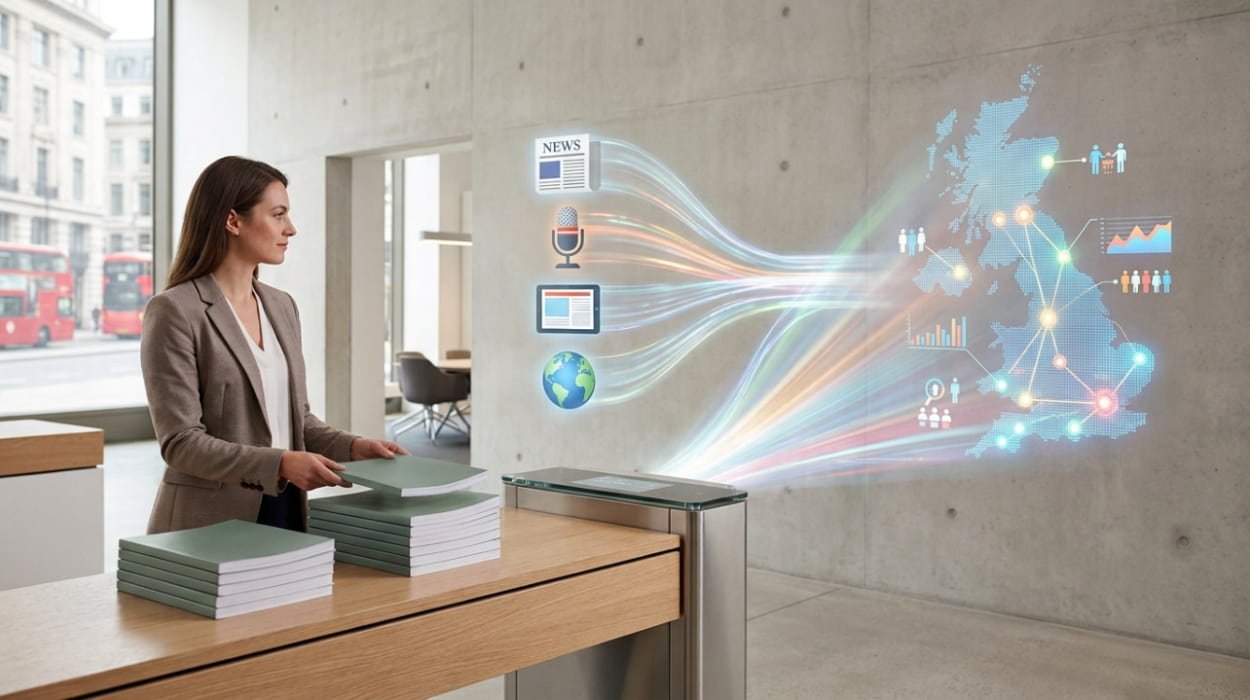
Rich media banners and video banners generate the highest engagement and click-through rates. Rich media banners achieve CTRs up to 0.5%, while video banners reach 0.4%. These formats outperform static images by integrating interactive elements and motion.
Banner advertising formats divide into static, animated, and interactive categories. Static banners display fixed images with text and calls to action. They load quickly but limit user interaction. Animated banners add movement through GIFs or simple transitions. These hold attention longer than static versions. Interactive formats, including rich media and video, embed playable elements like sliders, games, or short clips. Advertisers measure success through metrics such as click-through rate (CTR), defined as clicks divided by impressions multiplied by 100, and engagement rate, calculated as interactions per impression.
Rich media banners incorporate JavaScript for hover effects, expandable panels, and quizzes. Data from industry benchmarks shows these formats boost CTR by 2-3 times over static banners. Video banners autoplay muted loops or user-initiated plays within the banner space. They capture attention in under 3 seconds, leading to dwell times of 10-15 seconds per view. Publishers track these through viewability standards from the Interactive Advertising Bureau (IAB), ensuring 50% of pixels visible for at least one second.
How Do Rich Media Banners Work?
Rich media banners use HTML5 for cross-device compatibility. They trigger actions on user hover or click, such as expanding to full screen. Servers deliver these via ad tags embedded in website code. Engagement rises because users participate actively. CTR data indicates 0.3-0.5% for leaderboard sizes (728×90 pixels).
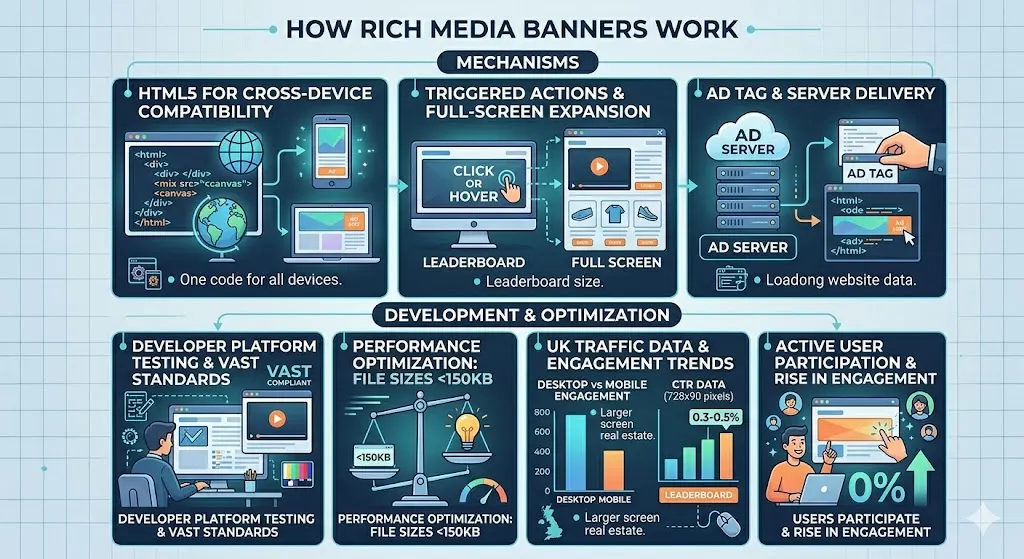
Developers test these formats on platforms supporting VAST standards for video integration. Performance optimizes with file sizes under 150KB. UK traffic data reveals higher engagement on desktop over mobile due to larger screen real estate.
Why Do Video Banners Excel in CTR?
Video banners stream short 15-second clips optimized for silent viewing. They use auto-play with captions to comply with user experience guidelines. Engagement metrics show 35% higher interaction rates than animated GIFs. Click-through occurs via overlaid buttons prompting site visits.
Analytics tools measure completion rates, where 70% of users watch full videos in high-performing campaigns. Format sizes like medium rectangle (300×250 pixels) balance visibility and load speed.
Which Banner Sizes Produce the Best Results?
Leaderboard (728×90 pixels) and medium rectangle (300×250 pixels) produce the highest CTRs at 0.2-0.4%. These sizes occupy prime screen positions and fit content flows without disruption.
Standard IAB sizes define banner dimensions for consistent delivery. Leaderboard spans full desktop widths above the fold, ensuring immediate visibility. Medium rectangle nests within article sidebars or content breaks. Both sizes generate billions of impressions annually across UK publishers. CTR benchmarks from display ad networks confirm their lead over smaller skyscrapers (120×600 pixels).
Placement influences performance. Above-the-fold leaderboards capture 80% of initial views. Medium rectangles in mid-page slots benefit from scroll depth data, where 60% of users reach 50% page length. Responsive designs adapt these to mobile, maintaining aspect ratios for 90% viewability.
What Makes Leaderboard Effective?
Leaderboard banners align with horizontal reading patterns. They display high-resolution creatives up to 150KB. UK e-commerce sites report 0.25% CTR averages. Heatmap studies show central text and buttons receive 40% more clicks.
Optimization involves A/B testing headlines and colors. Static versions load in 1 second, supporting high-traffic volumes.
How Does Medium Rectangle Perform on Mobile?
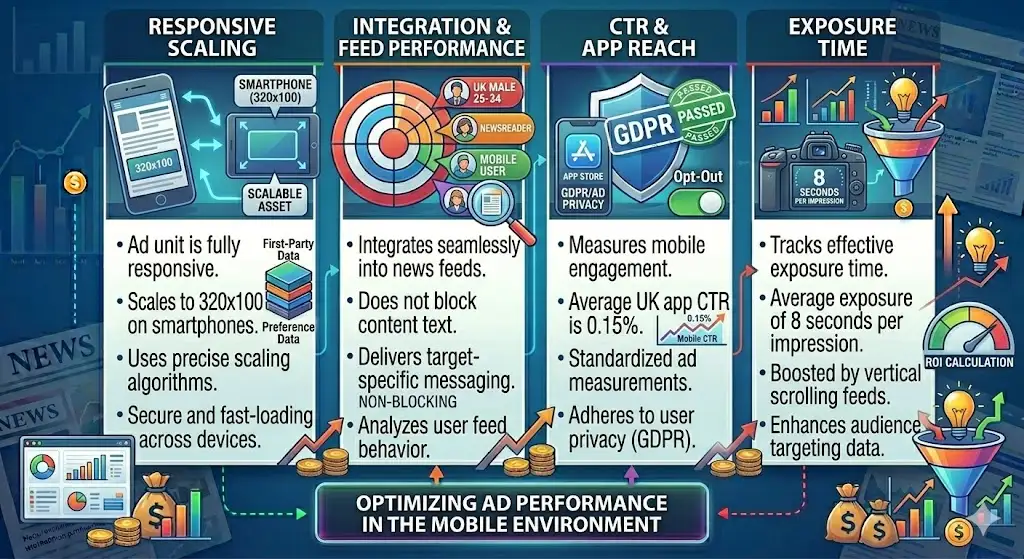
Medium rectangle scales to 320×100 on smartphones. It integrates into news feeds without blocking text. Mobile CTR reaches 0.15% in UK apps. Vertical scrolling increases exposure time to 8 seconds per impression.
What Interactive Elements Drive Engagement?
Carousels, expandable panels, and polls drive the highest engagement. Carousels increase CTR by 1.5 times; expandables by 2 times; polls achieve 0.6% interaction rates.
Interactive elements transform passive views into actions. Carousels rotate multiple images or messages on swipe or auto-advance. Expandable panels grow from standard sizes to reveal more content on hover. Polls ask binary questions with real-time feedback. These adhere to IAB guidelines limiting auto-expansions to 15% of original area.
Engagement data tracks micro-interactions like swipes (counted as 1.2x CTR boost) and completions. UK publisher reports show 25% lift in time spent on page. Formats cap at 1MB to preserve load times under 2 seconds.
Why Do Carousels Boost Click-Through?
Carousels present 3-5 variants in one space, reducing creative fatigue. Users swipe through products or testimonials. Benchmarks indicate 0.35% CTR for e-commerce carousels. Auto-advance intervals of 4 seconds optimize pacing.
How Expandable Panels Increase Visibility?
Expandable panels start compact and grow on interaction. They comply with polite loading, deferring expansion until page readiness. Engagement rises 40% per DoubleClick studies. Ideal for storytelling sequences.
How Does Animation Impact Click-Through Rates?
Subtle animations with 3-5 second loops generate 0.15-0.3% CTRs, outperforming static by 50%. Full-screen takeovers achieve 0.5% on exit intent triggers.
Animation adds motion to draw eyes without distraction. Loops repeat seamless transitions between states. Subtle effects include pulsing buttons or fading text. Takeovers interrupt politely on page exit, filling screens for 5 seconds. All animations use CSS or HTML5 for 60fps smoothness.
Performance metrics separate hover animations (doubling engagement) from idle loops. UK video consumption trends favor motion, with 2x dwell time. File optimization keeps payloads at 100KB.
What Loop Durations Work Best?
Loops of 3 seconds maintain rhythm without annoyance. They cycle key messages like price drops. CTR data shows 20% uplift over endless loops. Pause on hover extends interaction.
When Do Takeovers Perform Highest?
Takeovers trigger on scroll exit or inactivity. They display video or forms at 0.4% CTR. Frequency caps limit to once per session. High-value UK retail uses them for flash sales.
For deeper insights into banner platforms, check our guide on What Are Banner Advertising Platforms and How Do They Work for Brands Today?.
What Role Does Placement Play in Engagement?
Above-the-fold and in-content placements generate 0.3% CTRs, twice that of footer positions. News website sidebars yield 0.25% due to sustained visibility.
Placement positions banners relative to user scroll and focus. Above-the-fold appears without scrolling, capturing 70% of impressions. In-content slots integrate after paragraphs. Sidebar runs vertically alongside articles. Footer placements serve as last-resort views.
Viewability standards require 50% visibility for 1 second. UK news sites optimize with sticky sidebars, boosting engagement 30%. Heatmaps confirm central placements align with eye-tracking paths.
Why Above-the-Fold Wins?
Above-the-fold banners load first, achieving 90% viewability. Leaderboard formats dominate here. CTR averages 0.28% per industry data. Mobile first-screen placements match this.
How In-Content Slots Engage Readers?
In-content breaks mimic editorial flow. Medium rectangles fit 300×250 spaces. Users encounter them at 40% scroll depth. Interaction rates hit 0.22%.
To maximise returns from these formats, explore Maximise Advertising ROI With High Performing Banner Placements on News Websites.
Which Targeting Strategies Enhance Banner Performance?
Geo-targeting to UK postcodes and behavioral retargeting generate 0.4% CTRs. Contextual keyword matching on finance pages boosts engagement by 25%.
Targeting delivers banners to relevant audiences. Geo-targeting filters by location data. Behavioral retargeting serves ads to past site visitors. Contextual aligns with page content semantics. Demographics segment by age, gender, and interests from cookies.
UK regulations under GDPR require consent for tracking. Strategies combine first-party data with lookalike modeling. Performance lifts 2x over untargeted blasts.
How Does Geo-Targeting Work for UK Audiences?
Geo-targeting uses IP mapping to London or Manchester. It customizes messaging for local events. CTR reaches 0.35% for regional offers. Precision down to postcode level refines reach.
What Behavioral Retargeting Achieves?
Retargeting recalls cart abandoners with dynamic banners. Frequency of 3-5 exposures optimizes recall. Engagement metrics show 50% higher conversions.
How Do Performance Benchmarks Compare Formats?
Video banners lead at 0.41% CTR, rich media at 0.38%, leaderboards at 0.26%. Benchmarks derive from 10 billion UK impressions analyzed quarterly.
Benchmarks aggregate data from ad servers like Google Display Network. Video outperforms due to 15-second hooks. Rich media follows with interactivity. Static leaderboards provide baseline reliability. Mobile benchmarks lag desktop by 20% due to thumb zones.
Quarterly reports update figures. UK e-commerce averages exceed general display by 15%. Track via VCE Verified standards.