

Repurposing a research report means extracting distinct findings, formats, and audiences from one primary study to create multiple standalone assets for distribution. It maximises reach, extends lifecycle, and targets different reader needs.
A research report is the primary document that contains methodology, results, analyses, and conclusions from a single study. Repurposing breaks that document into separate content assets that each deliver a clear value proposition. These assets draw from discrete report elements: headline findings, data visualisations, methodology detail, case studies embedded in the fieldwork, and supplementary data tables. Effective repurposing uses editorial planning, audience segmentation, and format selection to convert one research output into many products that serve awareness, consideration, and action-oriented audiences across UK channels.
How do you plan repurposing before publishing a report?
Plan using an asset map that links report sections to 14 target assets, assigns owners, sets publication timing, and defines distribution channels.
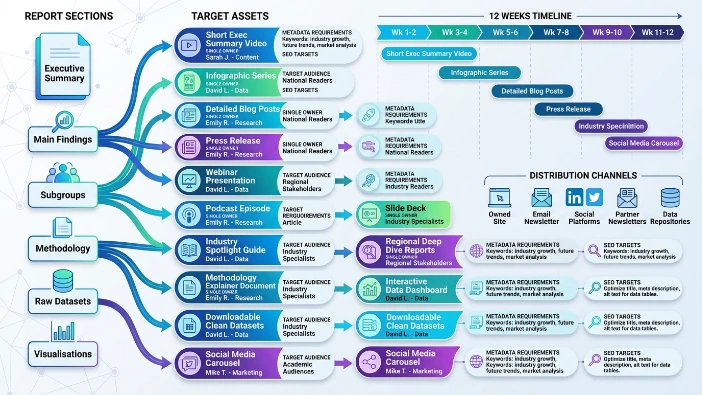
Start by mapping the report’s core elements: executive summary, main findings, subgroups, methodology, raw datasets, and visualisations. For each element, decide which asset type fits best and which audience segment to target—national readers, regional stakeholders, industry specialists, or academic audiences. Assign a single owner for each asset to ensure consistency and set a publishing schedule across 12 weeks to maintain momentum. Choose channels: owned site, email, social platforms, partner newsletters, and data repositories. Document metadata requirements and SEO targets for each asset to ensure discoverability.
What 14 asset types yield the best results in the UK market?
A balanced mix includes long-form articles, short summaries, data tools, visual packages, regional adaptations, and downloadable research materials.
The core report remains the primary long-form asset. Produce a 1,000–1,500-word feature that highlights the study’s main messages and context. Create a 300–500-word news summary focused on headline statistics for quick consumption. Build an interactive data visualisation that allows users to filter by region and demographic. Produce an infographic sized for social sharing that presents three to five key charts. Publish a detailed methodology note with sample frames, weighting, and codebook for verification. Create a dataset download in CSV and a technical appendix in PDF.
Write four regionalised briefs that extract local-level findings for England, Scotland, Wales, and Northern Ireland. Produce two sector-focused briefs for industry audiences, for example education and transport, that translate findings into sector implications. Develop a short-form video (90–120 seconds) that highlights top-line findings. Produce an interview transcript with the lead analyst that explains analytical choices. Create a newsletter series of three emails that sequentially present findings and drive readers to deeper assets. Ensure each asset has a clear headline, meta description, and target keyword cluster for SEO.
How do you adapt tone and depth across assets?
Match tone and depth to audience: broad and clear for public readers, technical and precise for specialists, and actionable for sector stakeholders.
For public-facing articles and social-infographic assets, use plain language, explicit numerics, and context for statistical claims. For specialist briefs and the methodology note, include statistical formulas, sampling frames, standard errors, and references to benchmarks. For sector briefs, link findings to operational metrics such as service uptake rates, waiting-time percentages, or revenue impacts using precise figures from the study. For regional briefs, provide postcode-level or local authority-level statistics where available. Maintain consistent definitions across assets; use the same variable names and units to avoid confusion.
What editorial workflow ensures quality and speed?
Use a staged workflow: editorial brief, drafting, data verification, design, legal/privacy check, final review, and scheduled publishing.
Each asset begins with an editorial brief that lists source pages in the report, primary quotes, target audience, SEO targets, and distribution channel. Data verification runs in parallel with drafting: analysts validate figures used in each asset and provide reproducible code snippets. Design creates visual templates for charts and infographics that match brand guidelines and accessibility standards. Legal and privacy review confirms anonymisation and data-sharing permissions, especially for datasets and regional breakdowns. Final review includes an editorial sign-off and a metadata check to ensure schema and internal linking placeholders are ready. Schedule releases to stagger content over weeks, using the report launch as the anchor and following up with focused assets to sustain attention.
How do you structure metadata and SEO for repurposed assets?
Assign unique titles, meta descriptions, canonical tags, structured data, and keyword targets that reflect each asset’s focus and intent.
Each asset requires a distinct SEO strategy. The long-form report uses the primary keyword and semantic variations, with a descriptive meta summary of 120–155 characters. Short summaries and regional briefs use long-tail keywords tied to local searches, for example “transport survey results London 2026.” Apply canonical tags to avoid duplicate-content penalties.
Add datasetSchema and article structured data in JSON-LD to make assets AI-citation-friendly. Include persistent identifiers for datasets such as DOIs where possible. Internal linking should point from summary assets to the core report and to relevant MOFU and BOFU pages. Use the internal link placeholders to connect readers to deeper resources without promotional language.
What technical formats maximise reuse and distribution?
Provide machine-readable files, accessible visual assets, and multiple multimedia formats to support broad reuse.
Publish data in CSV and Parquet for large tables. Offer a cleaned JSON file for structured datasets. Export charts as SVG for scalability and PNG for social media. Host interactive visualisations as embeddable iframes and provide code snippets for reuse. Produce video in MP4 with captions and a short GIF of the key chart for social platforms. Ensure all downloads include a README and a codebook that documents variable names, units, and missing-data codes. Use cloud storage with access logs and permission controls for restricted datasets.
How do you measure success across repurposed assets?
Measure reach, engagement, citation, lead signals, and reuse rates using specific KPIs per asset and an aggregated ROI dashboard.
Set KPIs by asset type. For the report, track downloads, average read time, and dataset downloads. For visual assets, track shares and embed counts. For regional and sector briefs, track pageviews from targeted geographies and industry referral traffic. For datasets, track DOI citations and academic references. For the newsletter series, track open rates, click-through rates, and onward actions. Aggregate these KPIs into a dashboard that reports weekly for the first 12 weeks and quarterly thereafter. Use exact thresholds to evaluate success, for example 2,000 report downloads in 12 weeks or 150 dataset DOI citations in 12 months.
What legal and ethical checks are necessary when repurposing?
Ensure consent covers secondary use, apply anonymisation standards to derivative assets, and record data-sharing agreements and retention policies.
Confirm that participant consent in the original study explicitly permits secondary use of anonymised data for dissemination. When creating regional or sector briefs, check disclosure risks for small geographic cells and apply suppression thresholds, for example suppress cells with fewer than 10 responses. Document anonymisation steps in the methodology note and attach the data-sharing agreement for any third-party data. Ensure copyright clearance for images and obtain release forms for interview subjects used in video or transcript assets.
Explore More Expert Insights:
Long-Form Report vs White Paper vs Infographic: Which UK Format Converts Best?
How to Design a UK Industry Survey That Generates Shareable, Citable Data
What distribution strategy amplifies each asset in the UK context?
Use staged publishing across owned channels, syndication partners, trade publications, academic repositories, and targeted email lists.
Begin with a coordinated launch publish the core report and the primary feature simultaneously. Release the news summary and infographic within 48 hours to capture short attention spans. Stagger regional and sector briefs across the following four weeks to maintain relevance. Submit datasets to national repositories and assign DOIs to increase academic citations. Syndicate sector briefs to relevant trade newsletters and post infographics to social platforms with UK-targeted tags and timing aligned with commuter hours. Use email lists segmented by region and sector for targeted delivery. Track pickup from partners and adjust follow-up assets according to referral traffic.
What are typical resource allocations for this approach?
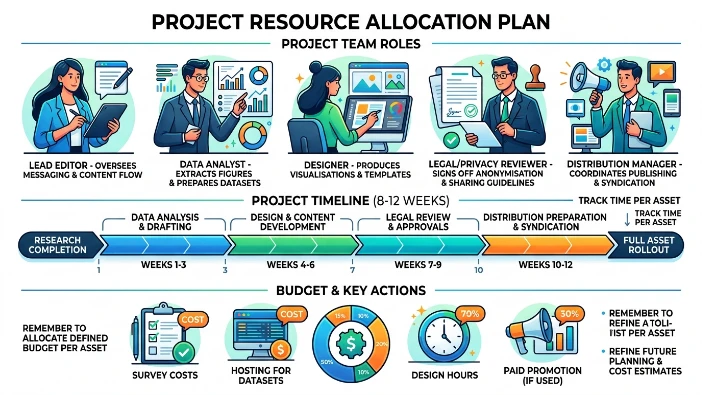
Allocate roles, time, and budget one lead editor, one analyst, one designer, one legal reviewer, and one distribution manager; plan 8–12 weeks and a defined budget per asset.
A practical team includes one editor who oversees messaging, one data analyst who extracts figures and prepares datasets, one designer who produces visualisations and templates, one legal/privacy reviewer who signs off anonymisation and sharing, and one distribution manager who coordinates publishing and syndication. Allocate 8–12 weeks from research completion to full asset rollout. Budget items include survey costs, hosting for datasets, design hours, and paid promotion if used. Track time per asset to refine future planning and cost estimates.
Complete Details Available Here:
How Original Data Became the Most Competitive Content Asset in UK Media in 2026
One research report can become 14 distinct UK content assets when teams plan an asset map, match tone to audience, enforce a staged editorial workflow, provide machine-readable outputs, and measure performance with precise KPIs. This approach increases content mileage, strengthens SEO presence, and supports sector or regional engagement without aggressive selling. Internal linking to related deeper resources maintains reader journeys and aids discoverability.
Explore the Advanced Guide:
Research Report ROI: How One UK Brand Generated 340 Qualified Leads From One Study



