
Sponsored content performance measurement quantifies how branded editorial content meets marketing goals using defined metrics and benchmarks. It tracks reach, engagement, attention, conversion, brand lift, viewability, dwell time, and return on investment to evaluate content effectiveness.
Sponsored content is editorial-style material paid for by a brand or advertiser and published within a publisher’s channels or partner platforms. Measurement converts qualitative outcomes into numeric indicators. Benchmarks provide context by showing expected ranges or target values for each metric within the United Kingdom market. Benchmarks enable comparison across publishers, formats, audiences, and campaigns. Measurement requires consistent definitions, reliable tracking tools, and aligned KPIs between sponsor and publisher.
How do you define clear KPIs for sponsored content?
Define KPIs by mapping campaign goals to measurable metrics such as impressions for awareness, clicks for consideration, and conversions for action. Use precise targets, timeframes, and attribution windows.
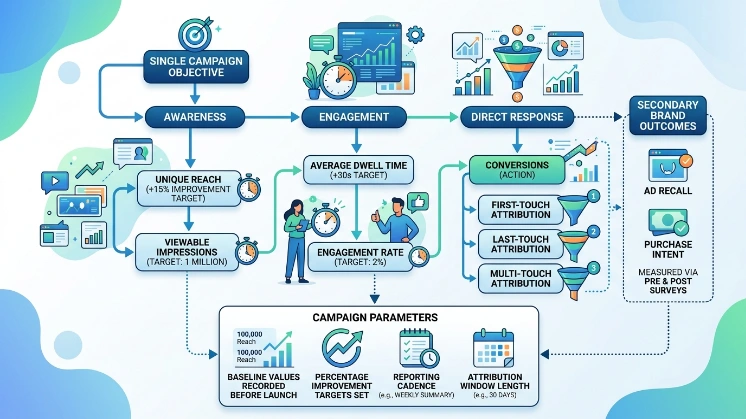
Start with a single campaign objective. For awareness, set a target for unique reach or viewable impressions. For engagement, set targets for average dwell time or engagement rate. For direct response, set conversion goals and attribute them using first-touch, last-touch, or multi-touch models. Include secondary KPIs for brand outcomes such as ad recall and purchase intent, measured via surveys. Record the baseline values before campaign launch and set percentage improvements as targets. Specify the reporting cadence and the attribution window length in days.
What eight benchmarks matter most for UK sponsored content?
The eight core benchmarks are: reach (unique viewable impressions), viewability rate, average dwell time, engagement rate, scroll depth, click-through rate, brand-lift metrics, and return on ad spend. Each benchmark provides insight into a distinct stage of the content funnel.
Reach measures how many unique users saw the content in viewable conditions. Viewability rate measures the share of impressions that meet industry viewability criteria. Dwell time measures average seconds users spend reading or interacting. Engagement rate measures interactions per view, including clicks, shares, or comments. Scroll depth measures content consumption as a percentage of article length. Click-through rate measures how often users click on embedded links or call-to-action elements. Brand-lift metrics measure changes in awareness, recall, or favorability via pre/post surveys. Return on ad spend (ROAS) or cost per acquisition quantifies economic returns against spend.
How do you measure reach and viewability accurately?
Measure reach using unique, cookie- or device-based identifiers and count only viewable impressions that meet the 50% in-view for one second standard. Use publisher logs and third-party ad measurement where possible.
Unique reach requires deduplication across devices and sessions. Viewable impressions use the industry standard: at least 50% of creative pixels in view for at least one continuous second for display and two seconds for video. Implement wrappers for native placements to report viewability. Cross-check server-side logs with client-side measurement to resolve discrepancies. Report reach as unique users and as reach percentage of the target audience. Provide confidence intervals when sampling is used.
What is the right way to track engagement and dwell time?
Track engagement and dwell time with event-based analytics that record scroll events, time-in-viewport, clicks, and media interactions per session. Use session-level timestamps to compute accurate dwell times.
Dwell time equals the difference between first and last interaction timestamps while the content remains in view. Exclude inactivity beyond defined thresholds, for example 30 seconds without interaction, to avoid inflated values. Capture scroll depth events at logical anchors (25%, 50%, 75%, 100%) to assess content completion. Track media play, pause, and completion for embedded audio or video. Combine engagement events into a composite engagement score if a single metric is required for comparison. Validate analytics against a control sample to ensure measurement integrity.
How should click-through and conversion metrics be attributed?
Attribute clicks and conversions with a defined model such as last-click, first-click, or multi-touch and state the chosen attribution window in days. Use server-side conversion tracking for accuracy.
For awareness-driven sponsored content, use multi-touch models to recognise upper-funnel influence. For direct-response campaigns, last-click attribution within a 7-to-30-day window captures short purchase cycles. Include view-through conversions where users saw the content without clicking and converted later; define view-through windows explicitly. Use consistent UTM parameters on links to preserve source data in analytics. Reconcile publisher-reported clicks and conversions with advertiser server data to identify tracking gaps.
What brand-lift studies should publishers and sponsors use?
Use randomised controlled surveys, split-sample tests, or pre/post panels to measure uplift in awareness, ad recall, consideration, and purchase intent. Keep sample sizes large enough for statistical significance and report confidence intervals.
Randomised controlled studies assign exposed and unexposed cohorts and measure metric differences. Split-sample tests run simultaneously on matched audiences to reduce temporal bias. Pre/post panel surveys the same respondents before and after exposure to measure change. For typical UK campaigns, aim for at least 400–1,000 respondents per cohort, depending on expected effect size. Report results with p-values and 95% confidence intervals. Document survey question wording, timing relative to exposure, and sampling methods to ensure repeatability.
What are realistic numeric benchmarks in the UK market?
UK benchmarks vary by format; common ranges are viewability 60–80%, average dwell time 45–120 seconds, engagement rate 2–8%, CTR 0.2–1.5%, and scroll completion 20–45%. Report benchmarks per format and audience segment.
Display and native placements show differing metrics. Native editorial content typically yields higher dwell times than standard display. Video-sponsored content often achieves viewability above 70% and completion rates between 30% and 60% for short formats under 60 seconds. Long-form articles targeting niche professional audiences can reach dwell times of 180+ seconds and scroll completion above 50%. For brand-lift, a 4–12 percentage-point increase in ad recall is common for well-targeted campaigns. For ROAS, benchmarks vary widely by industry and goal; present ROAS by conversion value relative to media spend.
How does measurement differ by content format and placement?
Measurement differs because formats drive user behaviour; long-form articles generate dwell and scroll metrics, while video emphasises viewability and completion rates. Adjust KPI selection to the content format and the publisher placement context.
Long-form editorial content suits dwell time, scroll depth, and social engagement as primary KPIs. Short native blurbs and sidebar sponsored links use CTR and immediate click metrics. Video content requires viewability, completion rate, and quartile reporting. In-feed placements on social platforms need in-platform metrics plus third-party validation for viewability. For multi-format campaigns, create an evaluation hierarchy that prioritises the most relevant metric per format and aggregates to a portfolio-level score.
Explore More Expert Insights:
How to Use Sponsored Content to Nurture UK Leads Who Are Not Ready to Buy Yet
Multi-Format Sponsored Campaigns: Combining Articles, Video and Infographics on UK Sites
What data quality practices ensure reliable benchmarks?
Ensure reliable benchmarks by using standardised definitions, third-party verification, consistent measurement windows, and auditable data pipelines. Maintain transparent documentation for each metric and measurement tool.
Adopt industry definitions for viewability and completion. Use independent verification services where budget permits. Standardise time zones, deduplication rules, and bot filtering. Store raw event logs for retrospective audits. Run pilot campaigns and cross-validate results across vendor reports. Publish benchmark methodology alongside results to preserve comparability.
What decisions follow from these benchmarks?
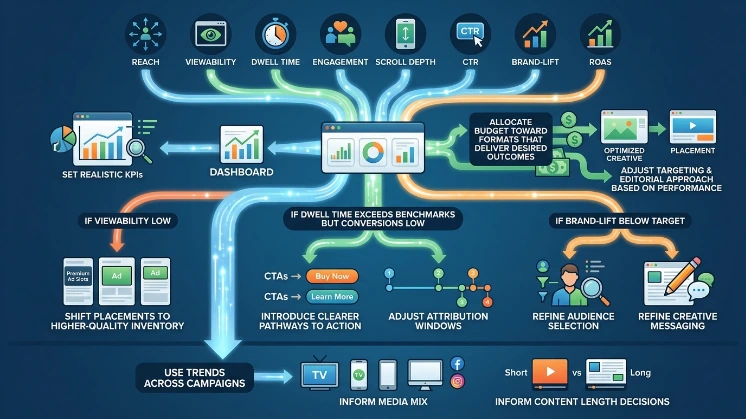
Use benchmarks to set realistic KPIs, optimise creative and placement, and allocate budget toward formats that deliver the desired outcomes. Adjust targeting and editorial approach based on benchmark performance.
If viewability falls below the expected range, shift placements to higher-quality inventory. If dwell time exceeds benchmarks but conversions remain low, introduce clearer pathways to action or adjust attribution windows. If brand-lift is below target, refine audience selection or creative messaging. Use benchmark trends across campaigns to inform media mix and content length decisions.
Read More to Understand Better:
The UK Branded Content Boom: What the £17.9bn Advertising Export Market Is Telling Us
This article defined sponsored content performance measurement and listed eight essential UK benchmarks: reach, viewability, dwell time, engagement, scroll depth, CTR, brand-lift, and ROAS. It explained KPI definition, measurement methods, attribution approaches, survey-based brand-lift, format-specific considerations, and data-quality controls. Use these benchmarks to set targets, compare campaign outcomes, and guide optimisation without relying on vendor-specific claims.
Get the Full Insights Here:
How Times Intelligence Editorial Teams Produce Sponsored Content Without Losing Credibility