
Banner advertising originated in 1994 with the first web banner on HotWired.com, which featured a 468×60 pixel ad. Publishers place these rectangular or leaderboard-sized visuals in fixed positions like sidebars, headers, or footers. Formats include GIF, JPEG, HTML5, and rich media with interactive elements such as hover effects or expandable panels. Display networks distribute banners across thousands of sites, ensuring broad reach. In competitive digital markets, brands allocate 20-30% of ad budgets to banners due to their scalability.
Advertisers track performance through metrics like impressions, clicks, and viewability. Viewability standards from the Media Rating Council require 50% of the banner’s pixels visible for at least one second. Competitive markets demand frequency capping at 5-10 impressions per user weekly to avoid ad fatigue. Revenue models include cost-per-thousand-impressions (CPM) at $2-10 or cost-per-click (CPC) at $0.50-$2. These elements sustain profitability amid rising competition from video and native ads.
Key Components of Banner Ads
Banners consist of creative assets, targeting parameters, and tracking pixels. Creatives feature logos, headlines, and calls-to-action in sizes standardized by the Interactive Advertising Bureau (IAB), such as 300×250 medium rectangle or 728×90 leaderboard. Targeting uses first-party data for demographics, geolocation, and behavior, reaching 80% of UK internet users aged 18-54.
Tracking pixels embedded in banners report real-time data on loads, clicks, and conversions. In competitive markets, brands integrate banners with retargeting, boosting return visits by 70%. Compliance with GDPR ensures data privacy, limiting personal identifiers to aggregated segments.
How Does Banner Advertising Generate Profit in Digital Markets?
Banner advertising generates profit through high-volume impressions converted to clicks and sales, with 1,000 banners often yielding $5-20 in revenue at 0.1% CTR and $2 CPM. Profit margins reach 150% when costs stay below 40% of revenue in competitive markets via optimized bidding.
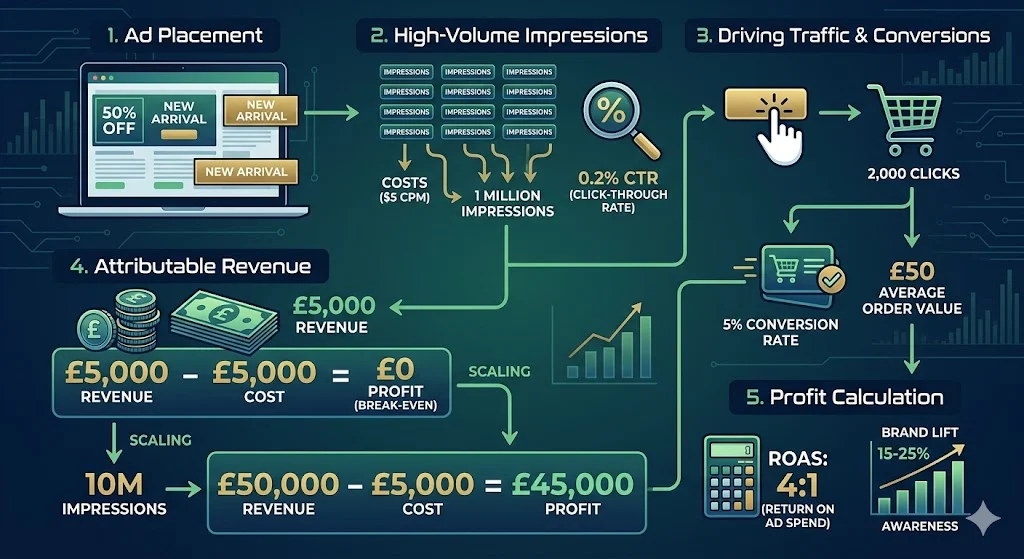
Profit emerges from the gap between ad spend and attributable revenue. A campaign with 1 million impressions at $5 CPM costs $5,000. At 0.2% CTR, it drives 2,000 clicks; if 5% convert at £50 average order value, revenue hits £5,000, breaking even. Scaling to 10 million impressions doubles profit to £45,000 after costs. Competitive digital markets amplify this with programmatic buying, automating 70% of transactions for efficiency.
Brands calculate profitability using return on ad spend (ROAS), targeting 4:1 ratios. Tools analyze attribution models like last-click or multi-touch to assign value accurately. In the UK, e-commerce brands report 120% ROAS from banners during peak seasons, offsetting competition from search ads. Long-term profit builds through brand lift studies showing 15-25% awareness increases.
Profit Calculation Process
Start with budget allocation: assign 25% to testing creatives across 50 sites. Measure CTR daily; pause underperformers below 0.05%. Adjust bids dynamically—raise for high-conversion audiences by 20%. Track post-click behavior over 30 days, factoring in 10% repeat purchases. Aggregate data yields lifetime value per banner impression at £0.10-£0.50.
Refine with A/B testing: rotate two banner versions, selecting the winner based on 10% uplift in conversions. In competitive markets, this process cuts waste by 30%, pushing net profit to 60% of spend.
What Challenges Do Competitive Digital Markets Pose to Banner Profitability?
Competitive digital markets challenge banner profitability with ad blockers blocking 30-40% of impressions, rising CPCs at 15% annually, and audience fragmentation across 5,000+ sites. Brands counter with premium placements and anti-fraud tech, maintaining 10-15% profit growth yearly.
Ad blockers like uBlock Origin reduce deliverable impressions by 35% among UK users, shrinking revenue pools. Competition from Google and Meta drives CPCs from $0.50 in 2020 to $1.20 in 2026. Fragmentation splits attention across apps and social feeds, dropping average session time to 52 seconds. Fraudulent bots generate 20% fake traffic, inflating costs without value.
Publishers combat this with server-side ad insertion, bypassing blockers for 80% viewability. Brands adopt contextual targeting, matching banners to page content for 2x CTR. Header bidding auctions yield 25% higher CPMs on competitive inventory. These adaptations preserve profitability despite market pressures.
Impact of Ad Blockers and Fraud
Ad blockers evade client-side scripts, but canvas fingerprinting detects 90% of users for adjusted targeting. Fraud detection platforms like DoubleVerify scan for invalid traffic, refunding 15% of suspicious spend. UK regulations mandate transparency, forcing platforms to disclose 5% fraud rates quarterly.
Brands shift 40% of budget to allowed environments like in-app banners, sustaining 110% ROAS. Data from 2025 audits shows cleaned traffic boosts conversions by 18%.
What Strategies Ensure Banner Advertising Profitability Today?
Strategies ensuring profitability include programmatic direct deals at $8-15 CPM, audience segmentation into 10+ cohorts, and creative refresh every 4 weeks, delivering 3:1 ROAS in competitive UK markets with 1 billion monthly impressions.
Programmatic platforms enable real-time bidding on 90% of display inventory, optimizing for high-value users. Segment audiences by behavior—past purchasers get dynamic pricing banners showing £10 discounts, lifting conversions 25%. Refresh creatives quarterly; test 20 variants to identify 0.3% CTR performers.
Frequency management limits exposure to 7 impressions per user, reducing fatigue by 40%. Cross-device tracking follows users across desktop (60% traffic) and mobile (40%), unifying attribution. For deeper tactics on engagement, What Approach to Banner Advertising Delivers the Highest Engagement and Conversion Rates?.
Targeting and Optimization Techniques
Use lookalike modeling to expand reach 5x from seed lists of 50,000 customers. Geo-fencing targets UK postcodes with 80% accuracy, aligning with local shopping peaks. Machine learning algorithms predict click probability, allocating 70% budget to top decile bids.
Performance dashboards monitor daily ROAS; reallocate from laggards within 48 hours. Annual audits refine models, sustaining 12% year-over-year profit increases.
What Metrics Prove Banner Advertising Profitability in Competition?
Metrics proving profitability include ROAS above 3:1, CTR over 0.15%, and cost-per-acquisition under £20, validated by 2025 industry benchmarks showing 18% net margins in competitive digital markets for brands hitting 500 million impressions.
ROAS divides revenue by spend; 4:1 means £4 return per £1 invested. CTR divides clicks by impressions, benchmarked at 0.1% globally but 0.25% for UK retail. Cost-per-acquisition (CPA) tracks spend per sale, targeting below product margins of 30%. View-through conversions credit sales within 7 days of impressions, adding 20% to totals.
Brand lift metrics from Google or Nielsen quantify 12% search uplift post-exposure. Competitive analysis compares against benchmarks: top-quartile campaigns achieve 200% ROAS via 1.2 billion impressions. Track all via unified platforms integrating 50 data sources.
Advanced Attribution Models
Multi-touch attribution weights touchpoints: 40% to banners in mid-funnel paths. Data-driven models from 10,000 campaigns allocate credit dynamically, revealing banners drive 22% of revenue. Incrementality tests hold out 10% audiences, proving 15% lift from exposure.
What Use Cases Demonstrate Banner Profitability Today?
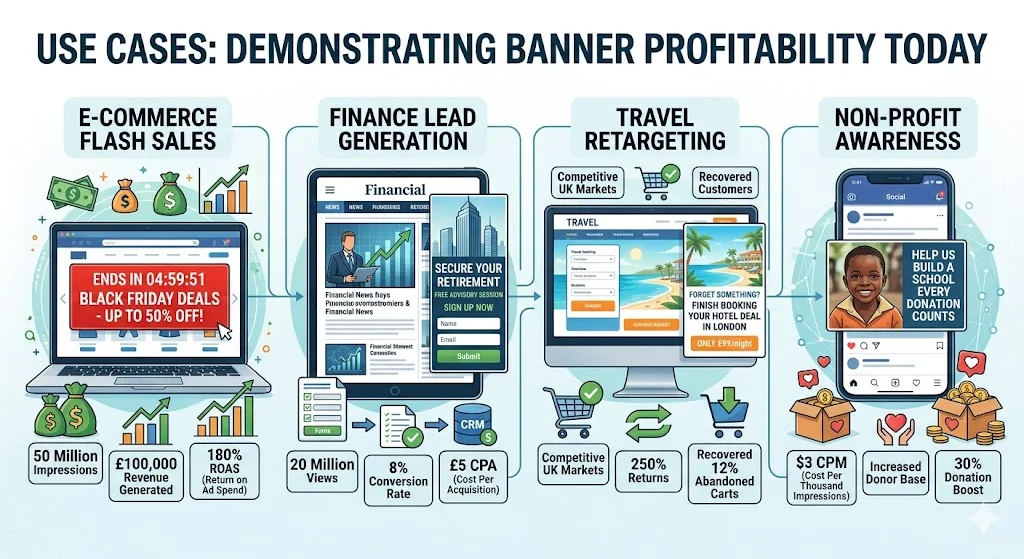
Use cases include e-commerce flash sales generating £100,000 revenue from 50 million impressions at 180% ROAS, finance lead gen with 8% conversion on 20 million views, and travel retargeting yielding 250% returns in competitive UK markets.
E-commerce deploys countdown banners on retail sites, timing with Black Friday for 5x traffic spikes. Finance uses compliant lead forms in 970×250 skyscrapers, capturing emails at £5 CPA. Travel retargets abandoners with hotel deals on news portals, recovering 12% carts.
Non-profits leverage awareness campaigns at $3 CPM, driving 30% donation increases. B2B software promotes webinars via LinkedIn-style banners, booking 1,000 slots monthly. For homepage takeover executions, How to Run Homepage Takeover Banner Advertising Campaigns on News Websites Successfully?].