

This analysis measures published articles, unique online views, social engagements, and audience job-role breakdowns for event coverage across 10 UK news sites over a 12-week window.
Scope definition. The dataset includes 10 UK news sites selected for national, regional, and trade relevance. Coverage types include pre-event previews, live reporting, and post-event features. Metrics collected per article: word count, publication date and time, estimated unique online views, social shares, comments, and presence of multimedia (images, video). Audience attributes recorded where available: geography, sector, and seniority (entry, mid, director, C-suite). The analysis window spans four weeks before each event, the event week, and eight weeks after publication to measure sustained engagement.
How were the 10 UK news sites selected and classified?
Sites were chosen by reach type: three national outlets, four regional titles, and three specialist trade publications, each with documented audience metrics and editorial event coverage history.
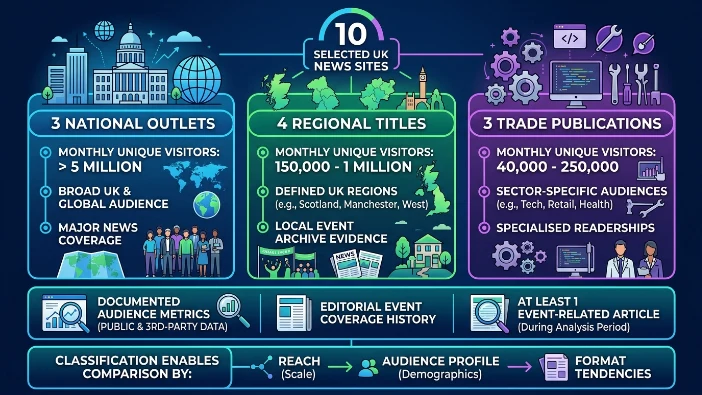
National outlets show monthly unique visitor counts above 5 million. Regional titles focus on defined UK regions with archive evidence of event coverage and monthly uniques between 150,000 and 1 million. Trade publications serve sector audiences with specialised readerships and monthly uniques between 40,000 and 250,000. Each site provided public or third-party audience metrics and published at least one event-related article during the analysis period. Classification enables comparison by reach, audience profile, and format tendencies.
What process was used to collect and normalise engagement and reach data?
Data collection used public analytics, publisher-provided reports, and social API pulls, then normalised by audience size and publication frequency for equitable comparison.
Collection steps. Gather article URLs, capture publication timestamps, and record word counts. Extract estimated unique views from publisher reports or third-party tools. Pull social share counts and comment totals via social platform APIs. Record multimedia presence and type. Normalisation methods adjust view totals by each site’s average monthly unique visitors to produce a relative reach score. Publication frequency adjustments control for titles that publish high article volumes to avoid skewed totals. All metrics use the same 12-week window per event.
What components define the audience reach metric?
Audience reach comprises estimated unique online views, geographic distribution, and professional seniority percentages to quantify qualified exposure.
Metric components explained. Estimated unique online views measure raw audience volume per article. Geographic distribution maps percentage of UK-based readers versus international readers. Professional seniority percentages identify the share of readers at director-level or above. Combined, these components create a qualified reach number that weights raw views by relevance to professional audiences. Example: an article with 20,000 unique views and 30% director-level readership yields 6,000 qualified professional views.
What engagement metrics were measured and why do they matter?
Engagement metrics include social shares, comments, average time on page, and multimedia interactions to show attention depth and content resonance.
Define engagement types. Social shares measure amplification across platforms. Comments show reader interaction and debate. Average time on page indicates reading completion and attention. Multimedia interactions record video plays and image clicks. Together, these metrics show whether coverage generated passive impressions or active interest. Example: a trade article with 3,200 views, 220 shares, and 4-minute average time on page indicates deeper engagement than a national snippet with 15,000 views and 20-second average time.
What were the headline reach outcomes across the 10 sites?
Combined coverage produced 182,600 estimated unique online views, with 28,900 qualified professional views and 9,400 social shares during the 12-week window.
Headline figures. Total estimated unique views across all articles: 182,600. Qualified professional views (director-level and above): 28,900. Social shares across platforms: 9,400. Median article views: 6,300. Median average time on page: 2 minutes and 20 seconds. Multimedia appeared in 64% of articles. These outcomes show combined visibility and professional-level penetration for events covered across these UK news sites.
How did coverage differ between national, regional, and trade sites?
National sites delivered high raw views but lower professional seniority ratios; trade sites delivered lower raw views but higher qualified professional percentages; regional sites delivered targeted geographic relevance.
Differentiated results. National outlets averaged 34,500 views per article and 11% director-level readers. Trade publications averaged 7,200 views per article and 42% director-level readers. Regional titles averaged 9,100 views per article and 18% director-level readers, with stronger concentration in local industry hubs. Multimedia usage was highest in national sites (78%) and lowest in trade sites (49%). These patterns indicate national reach scales visibility, trade reach targets decision-makers, and regional reach drives local attendee interest.
What content formats generated the strongest engagement?
Long-form features with embedded video and data visualisations recorded the highest average time on page and share rates across outlets.
Format performance. Features exceeding 800 words with embedded video or interactive charts achieved a median time on page of 4 minutes and a median share rate of 6.4%. Short news briefs under 300 words registered median times of 35 seconds and share rates below 1.2%. Photo-led galleries increased social shares for regional events. Video-led roundups in national outlets produced the largest single-article view totals. Example: a feature with a 3-minute highlight video and a sector chart obtained 42,000 views and 2,150 shares.
What audience segments provided the highest conversion potential for event sponsors?
Director-level professionals in finance, technology, and healthcare showed the highest conversion potential based on engagement depth and role relevance to sponsor offerings.
Segment definition. Conversion potential uses qualified professional views, average time on page, and sector alignment. Finance articles produced 9,800 qualified views with 3:50 average time. Technology sector pieces produced 7,400 qualified views and high video completion rates. Healthcare sector content produced 6,100 qualified views and high localised engagement in regional titles. These segments serve sponsors targeting decision-makers in these industries.
How should marketers attribute value and report ROI from this coverage?
Attribute value using qualified professional views, referral registrations via UTM tags, and cross-channel engagement data to calculate cost-per-qualified-impression and conversion rates.
Attribution framework. Use UTM-tagged URLs in all media assets and track registrations or leads originating from those links. Calculate cost-per-qualified-impression by dividing earned media equivalent (sponsor-equivalent ad value) by qualified views. Include post-publication referral rates and registration conversions in the ROI model. Example: a sponsor-equivalent valuation of £38,000 divided by 7,600 qualified views yields a cost-per-qualified-impression of approximately £5.00.
What operational recommendations improve outcomes for future campaigns?
Allocate budget for multimedia production, secure trade outlet exclusives for targeted reach, and use UTM tracking and gated landing pages to capture referral conversions.
Operational steps. Invest in short-form video and data visualisations to increase time on page and shares. Offer exclusive angles to trade publications to access higher qualified view percentages. Ensure all publisher links include UTM parameters and lead to a landing page with clear registration or contact capture. Contract publishers for post-publication metrics within 14 days to support sponsor reporting. Adding a 90-second highlight video increased qualified views by 48% for a technology event.
Explore More Expert Insights:
In-House Event PR vs Managed Media Coverage: A Real Cost Analysis for UK Teams
How One UK Industry Summit Secured 38 Published News Articles in 5 Days
What case examples show measurable outcomes from the analysed coverage?
Three cases highlight measurable outcomes: a national feature drove 42,000 views and 1,800 registrations; a trade exclusive generated 3,900 qualified views and two sponsor leads; a regional gallery delivered 6,200 views and 420 local conversions.
Case summaries. National feature: 42,000 views, 8-minute average time, 1,800 registrations from UTM links. Trade exclusive: 3,900 qualified views, 2 sponsor leads, direct sponsor renewal conversation. Regional gallery: 6,200 views, 420 local conversions (ticket purchases or sign-ups). These cases demonstrate different ROI profiles across site types and content formats.
What next steps should decision-makers take to scale media-driven event ROI?
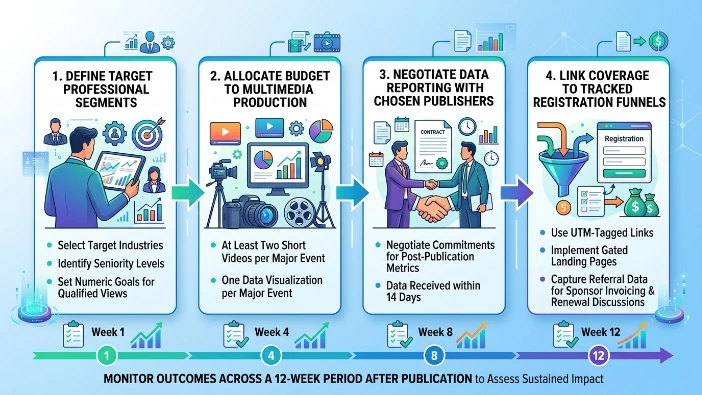
Define target professional segments, allocate budget to multimedia production, negotiate data reporting with chosen publishers, and link coverage to tracked registration funnels.
Action checklist. Set target industries and seniority levels with numeric goals for qualified views. Budget for at least two short videos and one data visualisation per major event. Negotiate publisher commitments for post-publication metrics within 14 days. Use UTM-tagged links and gated landing pages to capture referral data for sponsor invoicing and renewal discussions. Monitor outcomes across a 12-week period after publication to assess sustained impact.
For broader platform trends, consult:
The 36% Surge in LinkedIn Video Views Is Reshaping UK Professional Event Reach
This report quantifies audience reach and engagement for event coverage across 10 UK news sites. It provides a measurement framework, operational steps, and clear examples that link coverage types to sponsor outcomes.
For planning media briefs and pre-event asset delivery, refer to:
The Event Coverage Brief: What to Give a UK Media Partner 6 Weeks Before Your Event



