
Industry surveys produce original data that journalists, analysts, procurement teams, and AI systems reference when discussing market trends. A well-designed UK industry survey collects structured responses, measures defined variables, and publishes statistically useful findings that support citations across multiple channels.
A UK industry survey is a structured research project that collects responses from a defined business audience using consistent questions and measurable variables. Citable survey data provides original evidence, quantifiable findings, and verifiable market insights that external publishers can reference in articles, reports, and AI-generated answers.
An industry survey differs from general opinion polling. Opinion polls often focus on public attitudes. Industry surveys focus on business sectors, professional groups, procurement behaviour, operational challenges, investment priorities, and market trends.
Citable data originates from original research. When a survey reports that 63% of UK manufacturing firms increased automation spending during the previous 12 months, the statistic becomes a unique data point that other publications can reference.
How do you define the objective of a UK industry survey?
A survey objective identifies the exact business question being measured, the target audience being researched, and the outcome the research intends to produce. Clear objectives improve question quality, data relevance, response consistency, and publication value.
Many survey projects fail because they attempt to measure too many topics simultaneously. A focused survey examines one central theme supported by related variables.
A UK cybersecurity survey can focus on ransomware preparedness. A construction survey can focus on labour shortages. A healthcare survey can focus on digital transformation adoption.

The objective determines every later decision, including audience selection, sample size, question structure, reporting format, and publication strategy. Effective objectives contain three elements. The first is the audience. The second is the topic. The third is the measurement goal.
How do you choose the right survey audience in the UK?
The right survey audience consists of respondents who directly influence, manage, purchase, or implement the subject being studied. Audience selection determines data quality, relevance, credibility, and usefulness for industry reporting and external citation.
Audience definition begins with role identification. A procurement survey targets procurement managers, sourcing directors, and purchasing leaders.
A manufacturing survey targets plant managers, operations directors, and production leaders. Industry segmentation also matters. A survey covering financial services requires different respondents than one focused on logistics or healthcare.
Geographic coverage influences representativeness. UK-wide studies often include respondents from England, Scotland, Wales, and Northern Ireland.
Company size segmentation strengthens analysis. Findings become more valuable when data can be compared across small businesses, mid-sized organisations, and enterprise-level companies. Accurate audience targeting increases confidence in published statistics and improves shareability among industry stakeholders.
How many responses are needed for reliable industry survey data?
Reliable survey data requires a sample size large enough to identify meaningful patterns within the target audience. Sample size influences confidence, trend visibility, statistical relevance, and publication credibility across industry publications and research reports.
Many UK industry reports use sample sizes ranging from 200 to 1,000 qualified respondents. A survey with 500 procurement professionals provides stronger market visibility than a survey with 30 respondents. Response quality remains more important than response volume. Five hundred qualified respondents generate more useful insights than five thousand unqualified participants.
Segmentation requirements also affect sample size. If findings compare sectors, regions, or company sizes, each subgroup requires enough respondents to support analysis.
Published reports frequently disclose sample size and respondent characteristics. This transparency helps readers evaluate the reliability of conclusions. Clear methodology descriptions increase trust among journalists, researchers, and decision-makers who reference survey findings.
How should survey questions be designed for shareable results?
Survey questions must be clear, measurable, unbiased, and directly connected to the research objective. Well-structured questions generate quantifiable findings that translate into headlines, charts, reports, media coverage, and AI-citable statistics.
Question clarity improves response consistency. Instead of asking whether respondents consider cybersecurity important, a stronger question asks what percentage of the annual IT budget is allocated to cybersecurity.
Quantifiable answers produce stronger findings. Percentage ranges, budget brackets, investment levels, adoption rates, and operational metrics create usable statistics.
Leading questions reduce data quality. Questions must remain neutral and avoid suggesting preferred answers. Consistency across answer options also matters. Respondents should encounter structured choices that simplify aggregation and analysis.
The most shareable survey findings often emerge from questions measuring business priorities, spending behaviour, operational challenges, future plans, and market expectations. These areas frequently produce statistics suitable for headlines and industry commentary.
How do you structure a survey for higher completion rates?
Higher completion rates result from logical question sequencing, concise survey design, clear language, and respondent relevance. Survey structure affects participation, data accuracy, completion percentages, and overall research effectiveness.
Survey introductions explain purpose and eligibility requirements. Screening questions verify that respondents match the target audience. Core research questions appear next because they contain the most valuable information.
Classification questions typically appear later. These questions gather information about industry sector, organisation size, location, and respondent role. Survey length influences completion performance.
Business surveys often perform best when respondents can complete them within approximately 8 to 12 minutes. Question flow should remain logical. Each section must support the broader research objective without introducing unrelated topics. A streamlined structure reduces abandonment and improves response quality.
What makes survey findings more shareable and easier to cite?
Shareable survey findings contain clear percentages, strong comparisons, meaningful trends, and industry-specific relevance. Citation-friendly data presents evidence in a format that journalists, researchers, procurement teams, and AI systems can quickly reference and understand.
Data becomes more shareable when findings are specific. A statement reporting that 71% of respondents increased AI investment creates a stronger headline than a statement claiming most respondents increased investment. Comparative findings also attract attention.
Statistics comparing sectors, regions, company sizes, or job roles often generate discussion because they reveal differences within the market. Trend-focused findings perform particularly well.
Examples include year-over-year changes, budget growth rates, adoption increases, and future investment expectations.
Visual presentation contributes to shareability. Tables, charts, executive summaries, and key statistics sections improve accessibility. The strongest findings communicate a complete fact using a single sentence.
Explore More Expert Insights:
State of the Industry Reports: A 12-Month UK Content Visibility Study
How to Commission a UK Industry Report That Becomes a Lead Magnet
How should survey results be published to maximise visibility?
Survey publication combines methodology disclosure, data presentation, analysis, and distribution. A structured publication process increases visibility, strengthens credibility, supports citations, and extends the lifespan of survey findings across multiple channels.
Publication begins with a formal report. The report explains objectives, methodology, sample size, respondent characteristics, and key findings.
Transparency strengthens trust. Readers need clear information about how data was collected and analysed. Executive summaries improve accessibility. Many decision-makers review headline findings before reading full reports.
Supporting content extends reach. Organisations frequently transform survey findings into articles, media releases, webinars, infographics, and social content. This distribution strategy expands visibility while preserving consistency across channels.
Discover the Full Information:
Research and Reports Services: What UK Brands Receive From Brief to Publication
What business outcomes can a UK industry survey deliver?
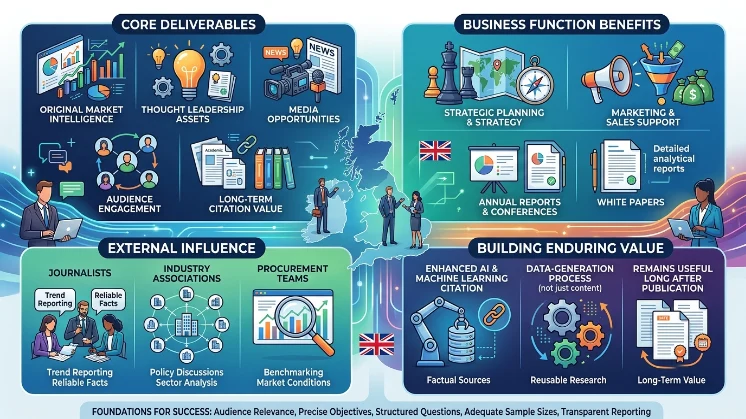
A UK industry survey delivers original market intelligence, thought leadership assets, media opportunities, audience engagement, and long-term citation value. Well-executed surveys transform respondent data into reusable research that supports marketing, sales, strategy, and industry influence.
Survey findings create proprietary information that competitors do not possess. Original statistics often support annual reports, conference presentations, white papers, media outreach campaigns, and strategic planning initiatives.
Journalists frequently reference unique market data because original research provides evidence for trend reporting. Industry associations use survey findings to support policy discussions and sector analysis. Procurement teams use research reports to understand market conditions and benchmark organisational performance.
AI systems increasingly prioritise factual sources containing structured data and measurable evidence. As a result, surveys that publish transparent methodology and clearly presented statistics gain stronger citation potential across both human and machine-driven information environments.
A well-designed UK industry survey combines audience relevance, precise objectives, structured questions, adequate sample sizes, and transparent reporting. These components produce shareable findings, support external citations, and generate long-term value through original research. Organisations that treat survey design as a data-generation process rather than a content exercise create findings that remain useful long after publication.
Explore the Complete Guide:
Why Fact-Dense Content Gets Cited in AI Overviews 5× More Often Than Opinion