
Sponsored content performance metrics are standardised numbers that show how sponsored articles or videos performed across UK publisher sites during a campaign. These metrics track measurable actions such as how many people saw the content, how many read or watched it, and how many took a desired next step such as visiting a website, signing up, or purchasing. Each metric ties directly to a specific behaviour or outcome, allowing marketers to assess whether the content met its stated objective.
Common high‑level metrics include impressions, which count how many times the sponsored piece loaded in a browser, and reach, which measures how many unique users saw it at least once. Engagement‑focused metrics include time on page, scroll depth, and click‑through rate, which show how deeply users interacted with the content. At the conversion level, metrics like conversion rate, cost per lead, and return on ad spend quantify how the content contributed to business outcomes.
Which metrics matter most for sponsored content?
For sponsored content campaigns, a small core set of metrics usually provides the clearest picture of performance. Impressions and reach establish the scale of visibility, while click‑through rate and engagement rate show how attractive the content and its placement were. Time on page and scroll depth help determine whether readers actually consumed the article or video, rather than just glancing at it.
At the bottom of the funnel, conversion‑related metrics are critical. These include conversion rate, cost per acquisition, and return on ad spend, all of which connect the content to leads, sign‑ups, or sales. Brand‑oriented metrics such as brand recall, aided and unaided awareness, and purchase intent typically come from third‑party measurement providers and post‑campaign surveys. Together, these metrics create a balanced view that links audience behaviour with business results.
How do you set up tracking for sponsored content campaigns?
To analyse sponsored content performance, marketers first define what success looks like for each campaign. They then translate that objective into specific KPIs, such as 10,000 clicks, 500 qualified leads, or a 20% increase in brand recall. After choosing KPIs, they configure tracking at the technical level using tools such as Google Analytics, server‑side tags, or dedicated campaign‑tracking platforms.
Publishers and partners typically provide unique URLs, UTM parameters, or tracking pixels for each sponsored piece. Marketers ensure these tags fire correctly on impressions, clicks, and conversions so that every interaction appears in the analytics environment. They also document attribution windows, such as a 7‑, 14‑, or 30‑day lookback period, so that assisted conversions are recorded consistently across channels.
What is the basic process for analysing performance data?
Analysing sponsored content performance follows a structured workflow. Marketers start by collecting raw data from all tracking sources, then clean and consolidate it into a single view. They then segment the data by dimensions such as publisher, placement, audience segment, and creative format to identify patterns.
Next, they compare actual results against pre‑defined KPIs and benchmarks. For example, they check whether the click‑through rate exceeded 3% or whether conversions met the target of 1,200 leads. If performance falls short, they examine subsets such as mobile vs desktop or specific age cohorts to isolate underperforming segments. Finally, they summarise findings in a concise report that highlights which variables drove success and which need adjustment.
How do you compare sponsored content to other channels?
Comparing sponsored content to other marketing channels involves aligning the metrics so they are measured on the same basis. For example, cost per acquisition from sponsored articles can be placed alongside cost per acquisition from search ads, social media ads, and email campaigns. Marketers then look at efficiency, volume, and quality of audience to decide where to allocate more budget. For deeper guidance on interpreting sponsored content metrics, read Track and Optimise Sponsored Content Campaigns With Our Data Driven Publishing?.
In practice, many UK campaigns show sponsored content delivering higher engagement and stronger brand recall than banner display, but sometimes lower immediate click‑through rates than paid search. Native‑style sponsored pieces often generate longer time‑on‑page and higher scroll depth than standard display, which can translate into better long‑term brand impact. These comparisons help marketers understand where sponsored content fits in the broader mix and what outcomes it is best suited for.
What role do benchmarks and historical data play?
Benchmarks and historical data allow marketers to judge whether a sponsored content campaign performed well or poorly in absolute terms. Industry benchmarks provide expectations for metrics such as typical click‑through rates, engagement levels, and cost per lead for specific verticals or audience groups. Internal historical data shows how past sponsored campaigns performed under similar conditions.
By comparing current results to both external benchmarks and past campaigns, marketers can detect meaningful shifts in performance. For example, if click‑through rates suddenly drop below the historical average, they investigate whether the change came from audience, format, or placement. If conversions exceed previous peaks, they look for which variables to replicate in future campaigns. This use of benchmarks transforms one‑off results into a repeatable performance framework.
How do segmentation and audience analysis improve insights?
Segmentation breaks sponsored content data into smaller, meaningful groups such as age bands, regions, devices, and interests. Analysing these segments reveals which audiences respond best to the content and which formats work optimally for each group. For example, a financial services brand might find that 35–44‑year‑old professionals in London engage more deeply with long‑form sponsored articles than 18–24‑year‑olds on mobile.
Audience analysis also exposes mismatches between targeting and performance. If a campaign targets high‑income professionals but the strongest engagement comes from a lower‑income segment, marketers can refine their targeting or adjust their creative approach. When combined with survey data, audience analysis can show how different segments perceive the brand before and after exposure, giving a clearer picture of the true impact of sponsored content.
How do you identify patterns and anomalies in the data?
Identifying patterns in sponsored content data involves examining how metrics behave over time and across placements. Marketers look for trends such as steady increases in engagement during certain weeks, consistent underperformance on specific publishers, or spikes in referrals around particular events. Visual dashboards and line charts help highlight these patterns quickly.
Anomalies are values that stand out from the norm, such as unusually high bounce rates on one piece or a sudden drop in conversion rates for a publisher. Marketers investigate these outliers by checking technical tracking, changes in audience, or editorial context to determine whether the spike or dip is genuine or due to a tracking error. Understanding patterns and anomalies allows marketers to separate noise from signal and focus on meaningful performance shifts.
How do A/B testing and creative variation help analysis?
A/B testing and creative variation make sponsored content performance analysis more precise by isolating which specific elements drive better results. Marketers test different headlines, images, layouts, or calls‑to‑action on otherwise identical placements to see how each variant performs. The results reveal which combinations produce higher clicks, longer time on page, or more conversions.
Over several tests, marketers accumulate evidence about what works for their audience. For example, they might discover that benefit‑oriented headlines drive 25% more clicks than feature‑oriented ones, or that short videos outperform static text in email referrals. This evidence base turns analysis from a one‑off exercise into a continuous learning process that informs future sponsored content strategy.
How do you turn analysis into concrete campaign improvements?
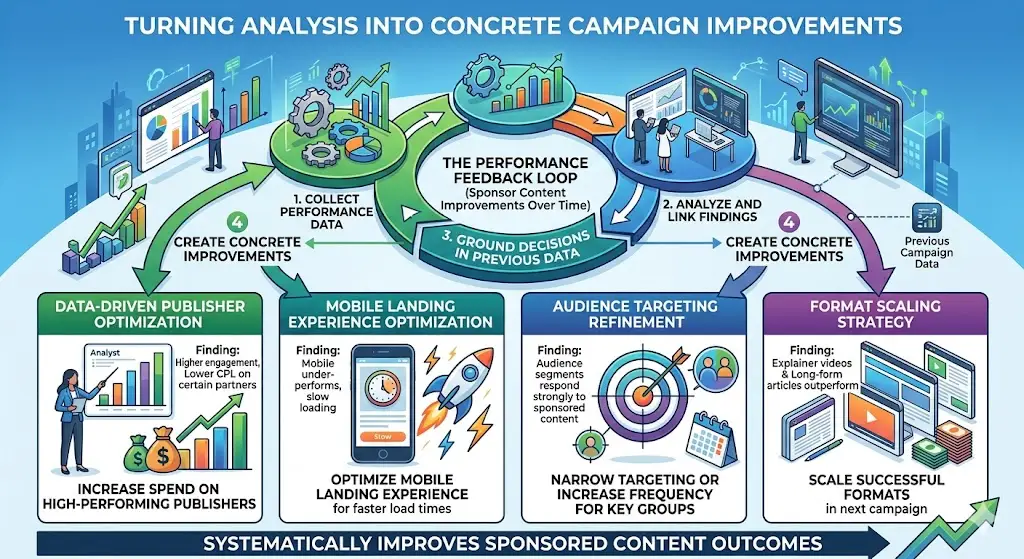
Turning analysis into improvements means linking findings directly to specific changes in strategy, targeting, or creative. If data shows that certain publishers consistently deliver higher engagement and lower cost per lead, marketers increase spend on those partners. If mobile underperforms because pages load slowly, they optimise the landing experience for faster load times.
If particular audience segments respond strongly to sponsored content, marketers narrow targeting or increase frequency for those groups. If certain formats such as long‑form articles or explainer videos outperform, they scale those formats in the next campaign. Each decision is grounded in previously collected performance data, creating a feedback loop that systematically improves sponsored content outcomes over time.
What common mistakes should marketers avoid when analysing sponsored content?
Common mistakes when analysing sponsored content include focusing only on surface‑level metrics such as impressions or clicks without looking at quality indicators or downstream conversions. Marketers also sometimes compare sponsored content to other channels without aligning attribution models or time windows, which leads to misleading conclusions. Another error is treating all data as equally reliable without checking for tracking gaps or technical issues.
Other pitfalls include failing to set clear KPIs before launch, which makes it difficult to judge success objectively, and relying solely on one metric instead of a balanced set. Marketers may also ignore segmentation and treat the entire audience as a single group, missing important differences in behaviour. Avoiding these mistakes leads to more accurate analysis and more reliable guidance for future sponsored content campaigns.
How does this connect to broader UK marketing trends?
In the UK, sponsored content is increasingly treated as a core performance channel rather than a purely brand‑building tactic. Marketers apply the same rigorous measurement standards to sponsored content that they use for search, social, and email campaigns. This shift means more campaigns are judged on both engagement and conversion metrics, not just impressions or coverage.
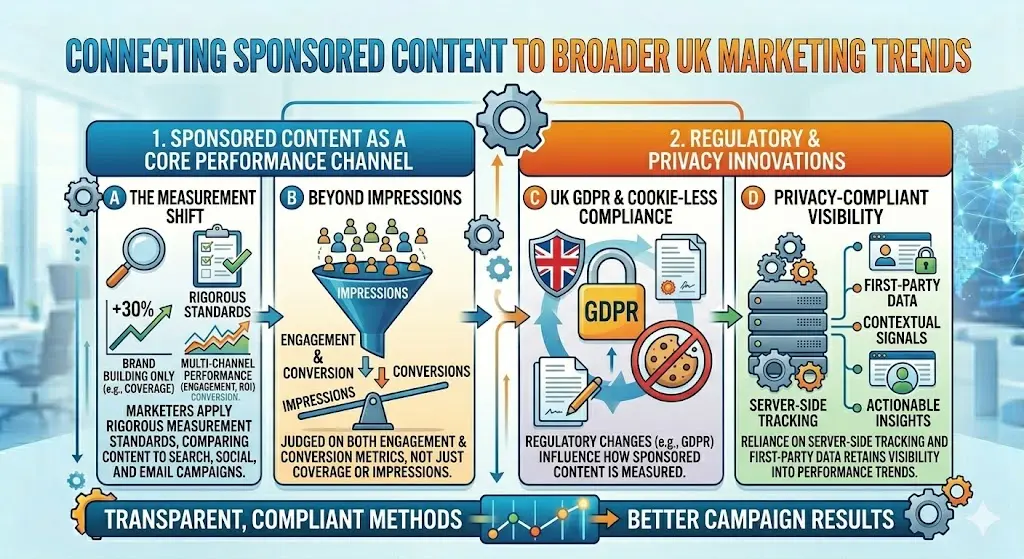
Regulatory and privacy changes, such as GDPR and cookie‑less tracking, also influence how sponsored content is measured. Marketers rely more on server‑side tracking, first‑party data, and contextual signals to retain visibility into performance. These trends push analysis toward more transparent, privacy‑compliant methods while still delivering actionable insights for better campaign results. For an overview of underlying performance trends across sponsored content, see Is There Reliable Data Showing Performance Trends of Sponsored Content Campaigns Today?.