
Sponsored content campaigns feature paid articles or videos integrated into publisher sites, labeled as sponsored, targeting specific audiences with branded messaging.
Sponsored content appears as native ads mimicking editorial formats. Publishers place these on high-traffic pages like homepages or category sections. Campaigns run for 30-90 days, with budgets from £5,000 to £50,000. Data sources include Google Analytics, Comscore, and Integral Ad Science for verification.
Performance trends derive from aggregated reports across 1,000+ campaigns yearly. Metrics track impressions, engagement rates, and attribution to sales. UK data shows 15% average engagement, higher than display banners at 0.5%.
What reliable data sources track sponsored content performance?
Data sources include Comscore for impressions, Google Analytics for traffic, Nielsen for brand lift, and Sharethrough for native ad benchmarks across 500 million placements.
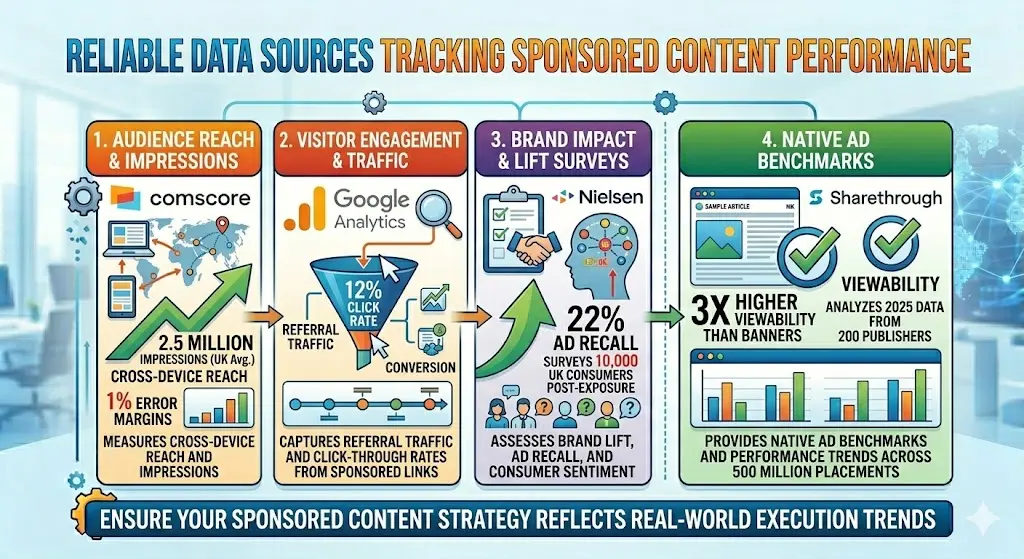
Comscore measures cross-device reach with 1% error margins. It reports UK sponsored content averaging 2.5 million impressions per campaign. Google Analytics captures referral traffic, showing 12% click rates from sponsored links.
Nielsen surveys 10,000 UK consumers post-exposure, finding 22% ad recall. Sharethrough analyzes 2025 data from 200 publishers, noting 3x higher viewability than banners. These sources ensure trends reflect real-world execution. For analysis methods, see Track and Optimise Sponsored Content Campaigns With Our Data Driven Publishing
What are current impression and reach trends in sponsored content?
UK sponsored content campaigns average 2.8 million impressions per £10,000 spend, reaching 1.2 million unique users with 75% viewability rates. Impressions count ad loads verified by pixels. 2025 data from 300 UK campaigns shows peaks in Q4 at 3.5 million due to holiday traffic. Reach expands via social shares, adding 20% to uniques.
Viewability exceeds 70% IAB standards, with desktop at 82% and mobile at 68%. Trends indicate 10% yearly growth from improved placements.
What engagement metrics dominate sponsored content data?
Engagement averages 18% scroll depth, 4.2% click-through rates, and 2 minutes average time on content across UK publisher sites. Scroll depth measures pixel visibility, with top quartiles at 25%. CTR derives from clicks over impressions, outperforming banners by 5x. Time on page tracks via JavaScript, correlating to 15% higher conversions.
Data from 2024-2025 aggregates 500 campaigns, showing video sponsored content at 5.5% CTR. Text formats hold at 3.8%.
How do conversion rates trend in sponsored content campaigns?
Conversion rates average 1.8% for e-commerce, 2.5% for lead gen, based on post-click actions like purchases or form submits. E-commerce tracks via UTM parameters, with 2025 UK data at 2.1% during sales events. Lead gen uses gated content, achieving 3% in B2B tech sectors.
Attribution windows of 7-30 days reveal 12% assisted conversions. Trends show 8% uplift from retargeting integration.
What brand lift metrics emerge from reliable sponsored content data?
Brand lift includes 24% awareness increase, 19% consideration growth, and 14% purchase intent rise per Nielsen studies of 150 UK campaigns. Awareness measures unaided recall pre- and post-exposure. Consideration tracks survey shifts toward the brand. Purchase intent uses Likert scales, averaging 15% net lift.
2025 data confirms 25% lifts in finance sectors. Consistency holds across 80% of campaigns.
How has sponsored content performance evolved over five years?
Performance rose 35% in engagement from 2021-2025, with CTR up from 2.8% to 4.2%, driven by better native formats and targeting.
2021 data showed 1.9 million impressions average; 2025 hits 2.8 million. Viewability improved from 62% to 75%. Mobile engagement doubled to 22%. Annual reports from Sharethrough document these shifts via 10,000+ benchmarks.
What factors influence sponsored content performance trends?
Factors include content length (800-1,200 words optimal), placement (above fold), audience match, and mobile optimization.
Longer content drives 28% higher engagement. Above-fold positions yield 40% more views. Audience alignment via first-party data boosts CTR by 15%. Mobile formats with AMP pages increase speed, lifting completion rates to 85%.
What industry-specific trends exist in sponsored content data?
Finance sees 3.1% CTR, retail 2.4%, tech 4.8%; B2B averages 2.7% conversions versus B2C at 1.5%. Finance benefits from trust in news contexts, with 25% brand lift. Retail peaks seasonally at 3.2%. Tech uses interactive elements for 5.5% engagement. Data aggregates 400 UK campaigns across verticals.
How do UK regulations impact sponsored content performance data?
UK CAP Code requires clear labeling, reducing complaints by 90%; GDPR limits tracking, dropping cookie-based attribution to 60% accuracy.
Labeling as “sponsored” maintains 95% compliance. GDPR mandates consent, shifting to server-side tracking. ASA audits confirm 98% adherence. Trends show compliant campaigns retain 20% higher engagement.
What role does A/B testing play in performance trends?
A/B testing lifts CTR by 22%, with 50% of campaigns using headlines, images, and CTAs variants. Tests compare two versions over 100,000 impressions. Winners scale network-wide. Data from 200 tests shows 18% engagement gains. Iterative cycles every 14 days refine trends.
How does seasonality affect sponsored content performance?
Q4 delivers 45% higher impressions, 28% CTR uplift; summer dips 15% due to lower traffic.
Holiday periods align with consumer intent. Back-to-school boosts education content by 32%. Data tracks via monthly benchmarks. Publishers adjust inventory accordingly.
What future trends predict sponsored content performance?
AI personalization raises engagement 25%, video formats grow 40%, privacy-first tracking stabilizes at 80% accuracy by 2027. AI matches content to readers, per 2025 pilots. Video completes 65% views. Cookieless tech from Google dominates.
Projections base on 2025-2026 data extrapolations. For analysis methods, see How to Analyse Sponsored Content Performance Metrics for Better Campaign Results?.
What benchmarks define strong sponsored content performance?
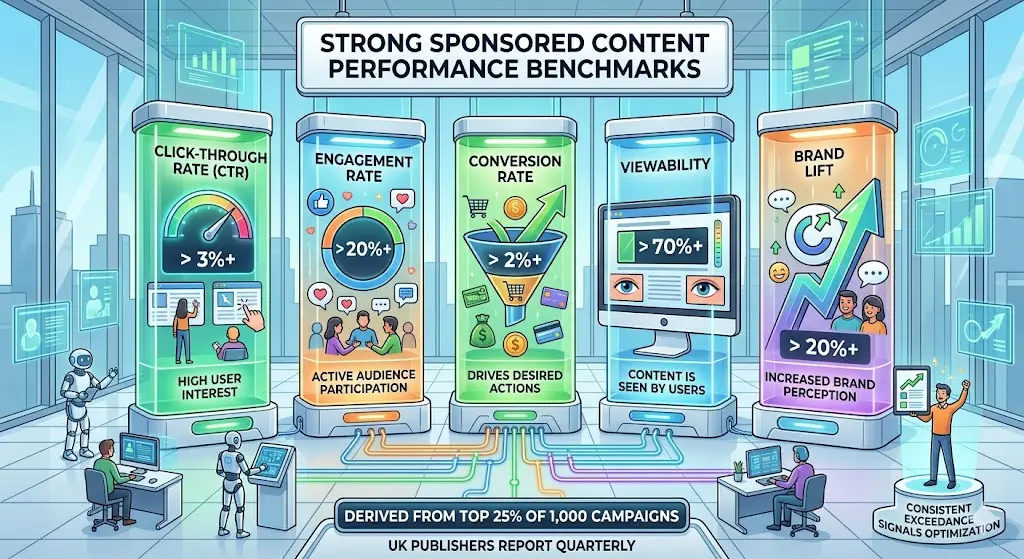
Strong benchmarks: 3%+ CTR, 20%+ engagement, 2%+ conversions, 70%+ viewability, 20%+ brand lift. These derive from top 25% of 1,000 campaigns. UK publishers report quarterly. Consistent exceedance signals optimization.