
A rapid-response data story is a journalistic piece built on freshly gathered quantitative metrics published within 24 hours of a major industry event, capturing active news cycles while maintaining statistical verification and strict factual accuracy standards across British media outlets.
The British media landscape operates on an intense 24-hour rolling news cycle managed by major agencies such as the Press Association, BBC News, and Reuters. When a breaking economic or industrial announcement occurs, journalists seek immediate quantitative context to validate public claims or refute political talking points. Traditional academic studies require months of peer review, making them obsolete for live breaking news. In contrast, rapid-response data stories deploy automated surveys, scraping tools, and rapid analysis templates to deliver verified statistics while public attention remains peaked.
Speed dictates whether a brand secures tier-one coverage or misses the news window entirely. Journalists face strict hourly deadlines. Providing clean datasets complete with verified regional breakdowns allows news desks to publish immediately. This responsiveness builds long-term editorial trust. When media outlets recognize a data provider consistently delivers accurate numbers under pressure, they prioritize those insights during subsequent breaking news cycles. Consequently, structured data collection frameworks eliminate the friction typically associated with urgent PR campaigns.
How Does the Data Collection Process Work Under Tight Deadlines?
Rapid data collection relies on pre-built consumer panels, automated digital scraping pipelines, and standardized survey instruments that capture minimum viable sample sizes of 1,000 respondents within four hours.
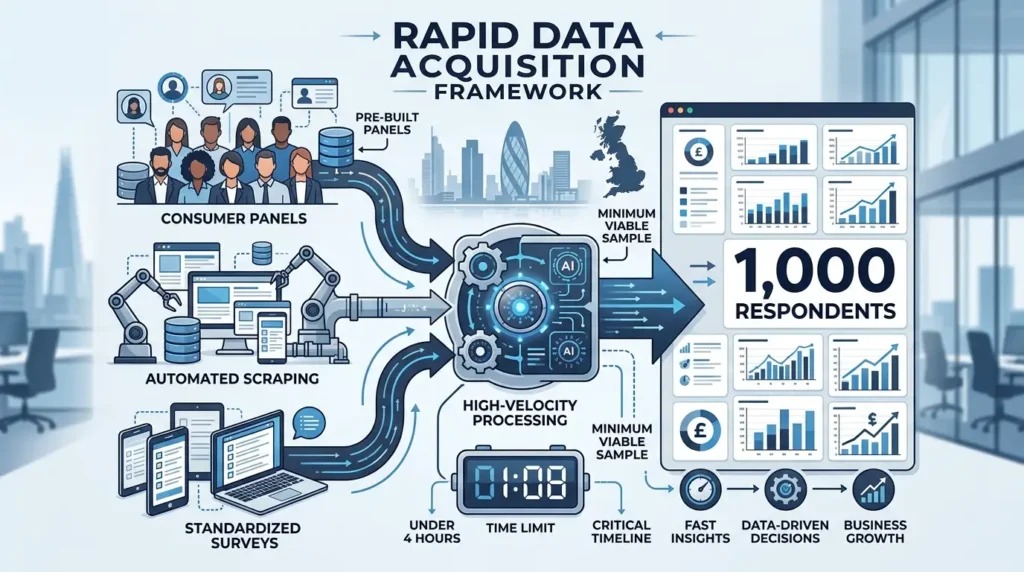
Executing a rapid-response data project requires pre-positioned infrastructure. Researchers maintain standing relationships with panel providers in the United Kingdom to deploy nationwide surveys instantaneously. A standard rapid survey targets a representative sample of 1,000 UK adults, stratified by age, gender, and geographic region to match Office for National Statistics benchmarks. Automated scripting tools execute questionnaire logic without manual intervention.
Automated Cleaning and Verification Protocols
Raw survey outputs undergo immediate automated data cleaning. Algorithms flag missing values, speeder responses completing surveys in under two minutes, and straight-lining patterns. Once cleaning concludes, statistical software calculates margins of error and confidence intervals. Analysts run cross-tabulations isolating specific variables, such as generational divides or regional disparities across London, Manchester, and Glasgow. This systematic pipeline compresses a traditional two-week research timeline into a strict 120-minute operational window.
Explore More Expert Insights:
Headlines for Sponsored Articles: 9 Formulas That Drive UK News Reader Clicks
Sponsored Content Calendar Planning: A 12-Month UK Framework for B2B Brands
What Are the Core Components of a News-Ready Data Report?
A news-ready data report consists of an eye-catching headline metric, a transparent methodology statement, localized regional breakouts, and downloadable visualization assets designed specifically for broadcast and print journalists.
Journalists require specific editorial components to convert raw spreadsheets into compelling narratives. Omitting any single component results in story rejection due to lack of verification or visual assets.
- The Lead Metric: A single, highly striking percentage or financial figure that summarises the core finding for use in news bulletins.
- Methodology Transparency: Exact field dates, sample sizes, exact question phrasings, and demographic weightings to satisfy editorial governance standards.
- Regional Breakouts: Granular data splits comparing attitudes across England, Scotland, Wales, and Northern Ireland to create localized angles for regional BBC and ITV hubs.
- Visual Assets: High-resolution charts, graphs, and infographics formatted for immediate digital embedding and broadcast screen graphics.
Understanding these foundational requirements helps media professionals evaluate different research models. Readers exploring foundational concepts can review what is a rapid-response data report for additional context. Furthermore, organizations evaluating commercial research partnerships can examine time intelligence media group research and reports services to scale their output.
How Can Brands Balance Speed With Statistical Rigor and Accuracy?
Balancing speed with accuracy requires adhering to Market Research Society guidelines, utilizing pre-approved survey templates, maintaining transparent sample sizes, and refusing to extrapolate beyond collected confidence intervals.
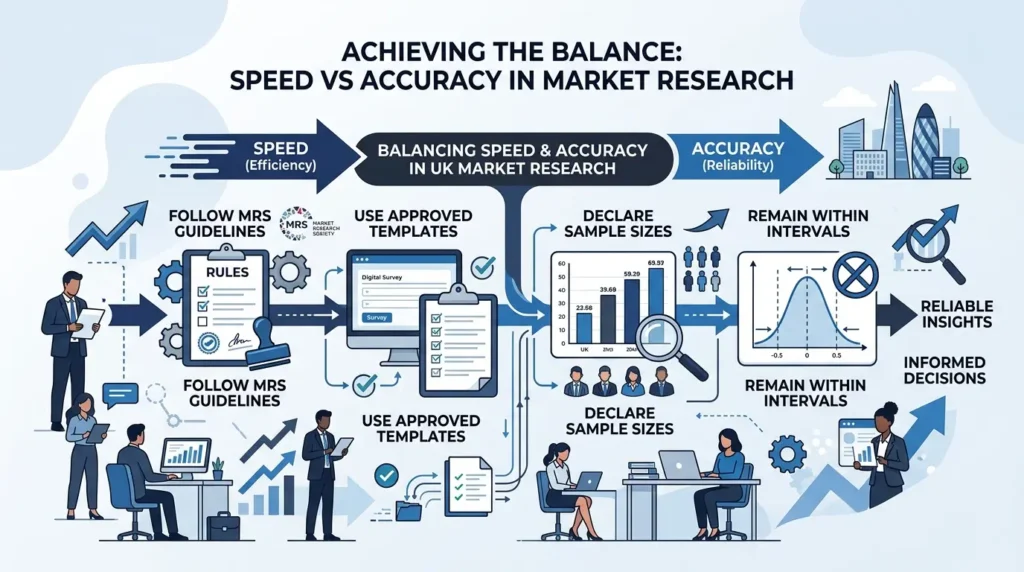
Speed introduces vulnerability to sampling errors and skewed phrasing. To maintain credibility within the UK media ecosystem, data teams implement rigorous quality controls. Researchers avoid leading questions that manufacture predetermined outcomes. Instead, they frame queries neutrally and test questions with pilot samples before full deployment.
Managing Margins of Error Under Pressure
Every rapid dataset carries a measurable margin of error, typically plus or minus three percentage points at a 95% confidence level for a sample of 1,000 respondents. Professional researchers explicitly state these statistical boundaries in press releases and media toolkits. When data points show negligible variance, analysts suppress the findings rather than exaggerating marginal differences. Maintaining this ethical boundary protects brands from accusations of data manipulation or greenwashing during high-stakes news cycles.
What Are Practical Use Cases for Rapid-Response Data in UK Industries?
Practical use cases include energy providers releasing consumer sentiment metrics during Ofgem price cap announcements, fintech firms publishing spending data during inflation reports, and retail brands tracking shopping habits during transport strikes.
Rapid-response data bridges the gap between corporate announcements and public interest journalism. Specific sectors utilize this methodology to anchor themselves as authoritative sources of truth during volatile periods.
Energy and Utility Sector Applications
When regulatory bodies announce energy price adjustments, utility providers deploy rapid consumer sentiment surveys within two hours. By publishing findings on how households plan to manage heating budgets, these brands secure prominent placement in broadcast news segments and financial columns.
Financial Services and FinTech Responses
Fintech platforms utilize transaction data aggregations during monthly Consumer Price Index releases. By analyzing millions of anonymous user transactions instantly, these companies provide journalists with ground-truth spending data that surpasses government lag times, cementing their market authority.