
Technology companies collect large volumes of product data every day. Product usage, customer behaviour, feature adoption, security events, and performance metrics all contain valuable market insights. Converting this information into a structured industry report creates original research that attracts journalists, analysts, customers, and industry publications.
A data-driven industry report supports thought leadership, strengthens search visibility, and earns authoritative backlinks. It also provides valuable assets for marketing, sales, and public relations teams.
This guide explains the complete process of transforming internal product data into a credible technology industry report that earns attention across the United Kingdom and international technology markets.
What is an internal product data industry report?
An internal product data industry report is a research publication built from anonymised customer and platform data. It identifies measurable industry trends, explains market behaviour, supports technology discussions with evidence, and provides original statistics that external publications can reference confidently.
An internal product data industry report uses first-party data collected directly from a company’s products or services. Unlike surveys that depend on participant responses, first-party data reflects actual product usage and operational activity.
Examples of product data include:
- API request volumes
- Cloud infrastructure usage
- AI model adoption
- Feature activation rates
- Software deployment frequency
- Security incident detection
- Customer onboarding duration
Technology publications regularly cite reports containing original statistics because they introduce information unavailable elsewhere.
Publishing first-party research also supports long-term content marketing. Businesses comparing research strategies can explore:
Tech Thought Leadership for broader planning.
What makes first-party data valuable?
First-party data has three defining characteristics:
- It originates from real product activity.
- It represents measurable customer behaviour.
- It updates continuously over time.
These qualities improve credibility compared with opinion-based content.
How do you identify report-worthy data?
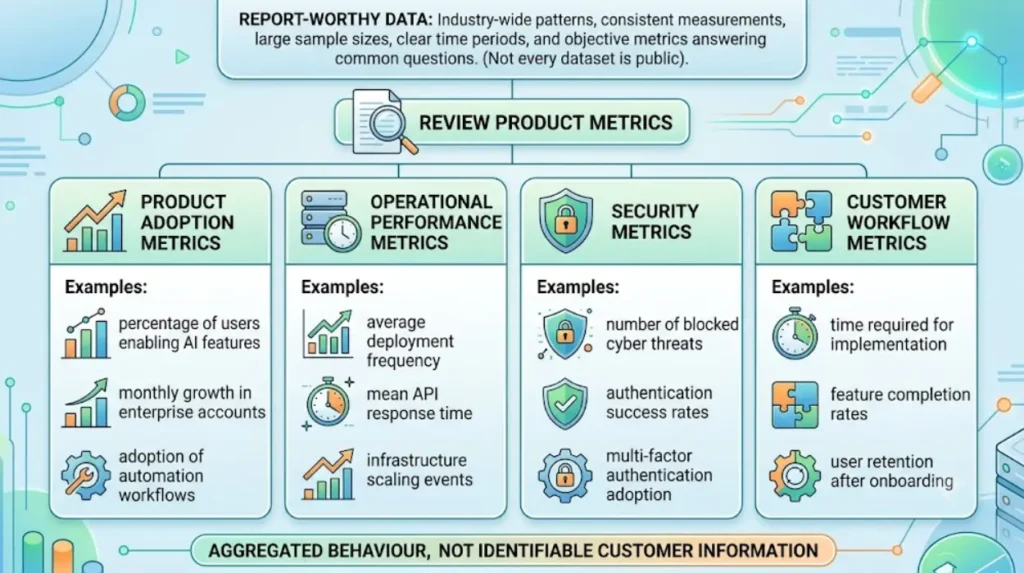
Report-worthy data demonstrates industry-wide patterns rather than individual customer stories. The strongest datasets contain consistent measurements, large sample sizes, clear time periods, and metrics that answer common questions within the technology sector using objective evidence.
Not every dataset belongs in a public report.
Begin by reviewing available product metrics.
Useful datasets include:
Product adoption metrics
Examples include:
- Percentage of users enabling AI features
- Monthly growth in enterprise accounts
- Adoption of automation workflows
Operational performance metrics
Examples include:
- Average deployment frequency
- Mean API response time
- Infrastructure scaling events
Security metrics
Examples include:
- Number of blocked cyber threats
- Authentication success rates
- Multi-factor authentication adoption
Customer workflow metrics
Examples include:
- Time required for implementation
- Feature completion rates
- User retention after onboarding
Each metric must represent aggregated behaviour rather than identifiable customer information.
How do you prepare internal data for publication?
Preparing product data requires anonymisation, validation, categorisation, and statistical cleaning. Every published metric must remove customer identifiers, eliminate duplicate records, define measurement periods, and document calculation methods to ensure transparent and reproducible reporting standards.
Raw operational data rarely belongs in a public report without processing.
Remove sensitive information
Delete all personally identifiable information.
Remove:
- Company names
- Email addresses
- User identifiers
- IP addresses
- Account numbers
Publish aggregated statistics instead.
Standardise measurements
Use one reporting period.
Examples include:
- January to December
- Quarter 1 to Quarter 4
- Previous 24 months
Consistent reporting periods improve comparisons.
Verify accuracy
Check every calculation.
Confirm:
- Sample size
- Percentage totals
- Median values
- Growth rates
Errors reduce report credibility and media trust.
How do you discover meaningful trends?
Meaningful trends emerge through comparisons across time, industries, organisation sizes, or technology categories. Every reported finding requires statistical support, clear definitions, and logical interpretation based on observable behavioural patterns rather than assumptions or predictions.
Raw numbers become valuable after comparison.
Examples include:
- AI feature adoption increased from 18% to 61%.
- Average deployment time decreased from 14 hours to 5 hours.
- Enterprise organisations activated automation 2.8 times faster than small businesses.
These comparisons create newsworthy findings.
Compare historical performance
Historical analysis identifies long-term change.
Useful comparisons include:
- Annual growth
- Quarterly performance
- Multi-year trends
Segment the audience
Break findings into categories such as:
- Industry
- Company size
- Region
- Technology stack
Segmentation increases relevance for specialised publications.
How do you structure the report?
A structured report follows a logical research format consisting of methodology, key findings, supporting analysis, visual evidence, and conclusions. Consistent organisation improves readability, strengthens credibility, and allows journalists to locate reference statistics quickly during editorial research.
A professional technology report follows a predictable structure.
Executive summary
Present the most significant findings.
Example:
- AI adoption reached 74%.
- Deployment frequency increased by 42%.
- Security incidents declined by 18%.
Methodology
Explain:
- Data sources
- Sample size
- Collection period
- Analysis process
- Definitions
Methodology increases trust.
Key findings
Present major statistics first.
Support every statistic with context.
Supporting chapters
Expand each major finding.
Examples include:
- Cloud adoption
- AI implementation
- Developer productivity
- Enterprise security
- Infrastructure growth
Conclusion
Summarise measurable industry developments without introducing unsupported claims.
How do charts and visuals improve industry reports?
Clear charts convert complex datasets into understandable visual evidence. Well-designed graphs highlight comparisons, reveal patterns, simplify statistical interpretation, and improve media usability across articles, presentations, and digital publications without changing the underlying research findings.
Visual assets increase report engagement.
Useful chart types include:
- Line charts for growth
- Bar charts for comparisons
- Pie charts for distribution
- Heat maps for regional activity
- Tables for detailed statistics
Every chart requires:
- Labels
- Units
- Data source
- Reporting period
Visual consistency improves usability.
How do you make the report newsworthy?
Newsworthy reports answer current industry questions using original statistics supported by transparent research. Editors prioritise reports containing surprising findings, measurable market shifts, large datasets, and practical relevance for technology professionals, investors, and enterprise decision-makers.
Editors look for stories that affect large audiences.
Strong headlines often highlight:
- Record growth
- Industry change
- Security developments
- AI adoption
- Productivity improvements
Examples include:
- AI coding assistants reached 68% enterprise adoption.
- Average software deployment frequency doubled in one year.
- Multi-cloud usage increased by 41%.
Each headline focuses on measurable evidence.
How do you distribute an industry report effectively?
Industry reports achieve wider visibility through coordinated publication, media outreach, search optimisation, executive commentary, and supporting content assets. Combining multiple distribution channels increases opportunities for backlinks, citations, interviews, newsletter coverage, and ongoing search traffic.
Publishing alone rarely maximises visibility.
Effective distribution includes:
Dedicated landing page
Publish the report on a searchable webpage.
Include:
- Summary
- Download option
- Key statistics
- Charts
Press announcement
Create a news-focused release highlighting the strongest findings.
Supporting content
Repurpose findings into:
- Blog articles
- Infographics
- Social media posts
- Webinar presentations
- Executive interviews
Businesses evaluating structured publication methods can compare:
Enterprise Tech PR Distribution when reviewing distribution approaches.
What mistakes reduce the impact of a technology industry report?
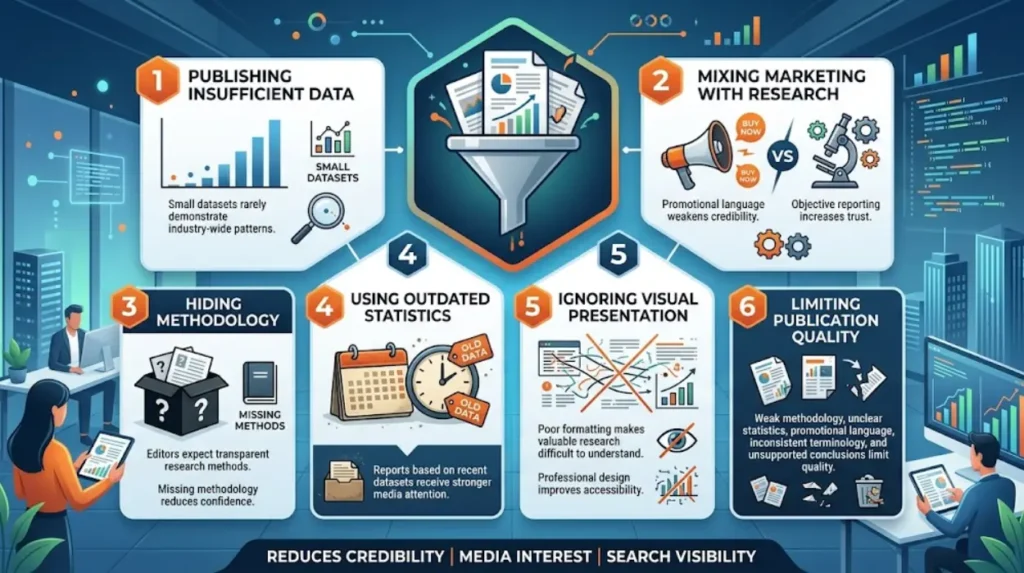
Several avoidable mistakes reduce report credibility, media interest, and search visibility. Weak methodology, unclear statistics, promotional language, inconsistent terminology, and unsupported conclusions limit publication quality and reduce opportunities for citations across authoritative technology sources.
Common reporting mistakes include:
Publishing insufficient data
Small datasets rarely demonstrate industry-wide patterns.
Mixing marketing with research
Objective reporting increases trust.
Promotional language weakens credibility.
Hiding methodology
Editors expect transparent research methods.
Missing methodology reduces confidence.
Using outdated statistics
Reports based on recent datasets receive stronger media attention.
Ignoring visual presentation
Poor formatting makes valuable research difficult to understand.
Professional design improves accessibility.
How can technology companies benefit from publishing original industry reports?
Original industry reports strengthen authority, improve search performance, support media coverage, generate backlinks, enable executive thought leadership, and provide reusable marketing assets built upon measurable evidence instead of promotional messaging or unverified industry assumptions.
One research project creates value across multiple business functions.
Explore More Expert Insights:
How to Leverage Software Product Launches to Earn High-DA Backlinks Naturally
The Founder’s Guide to Building a Tech Media Pitch Deck That Converts
Benefits include:
- Original statistics for future articles
- High-authority backlinks
- Increased media references
- Stronger executive visibility
- Improved organic search performance
- Sales enablement content
- Conference speaking material
- Investor communication assets
Technology buyers increasingly evaluate evidence before selecting software vendors. Research-backed reporting provides measurable information that supports informed decision-making while improving long-term digital visibility.
Turning internal product data into a viral technology industry report begins with identifying reliable first-party data, preparing it through anonymisation and validation, analysing meaningful trends, and presenting findings within a transparent research framework. Clear methodology, compelling statistics, informative visuals, and coordinated distribution transform operational data into a trusted industry resource. Organisations that consistently publish evidence-based reports build stronger authority, earn valuable media citations, and create long-lasting content assets that support search visibility, thought leadership, and business growth.