
Optimizing stories based on engagement metrics revolutionizes how media outlets create content that captivates and retains audiences. In a crowded digital space, raw story ideas must evolve through data-driven refinement to boost shares, dwell time, and conversions. Audience insights services provide the foundation for this transformation.
Engagement metrics—such as click-through rates, bounce rates, and social shares—offer precise feedback on what works. Time Intelligence Media Group highlights that outlets mastering this see up to 40% higher retention, turning casual readers into loyal subscribers.
Identifying High-Impact Metrics Like Dwell Time and Shares
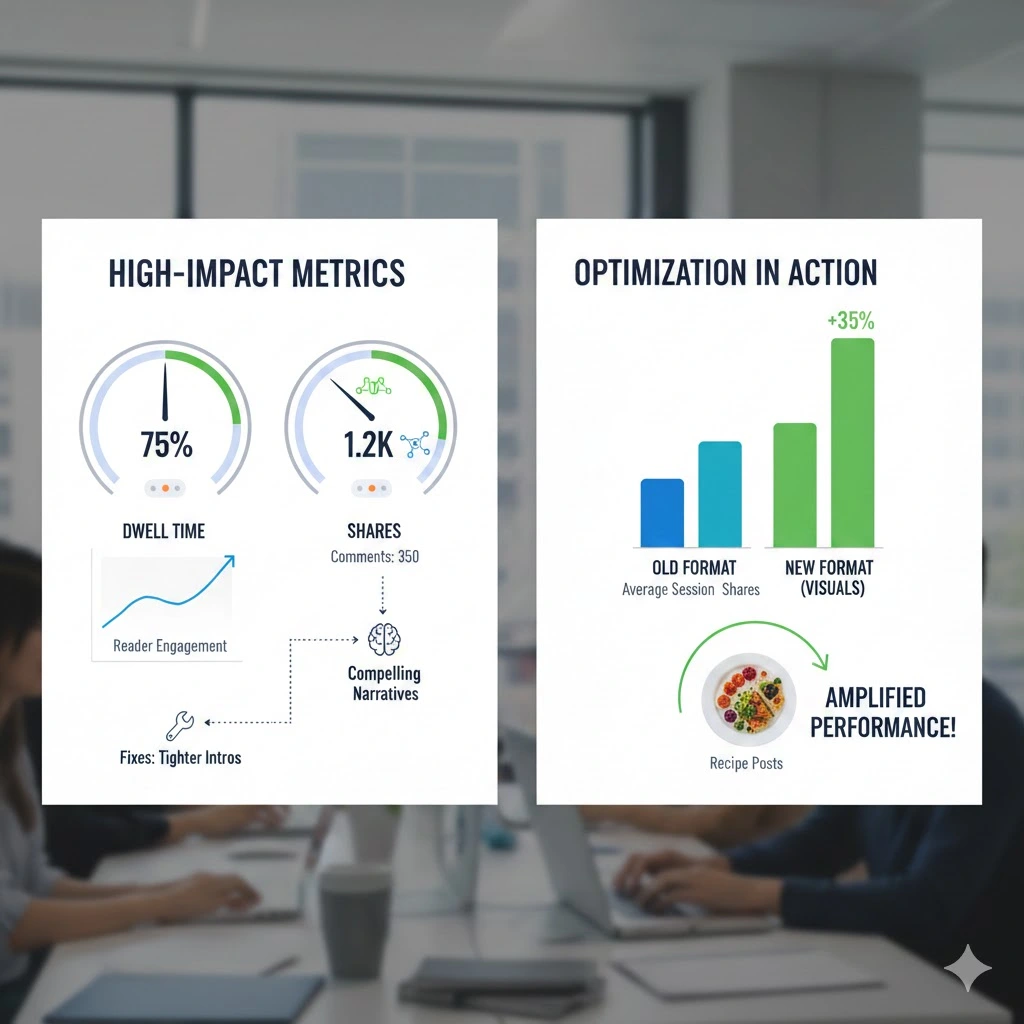
Optimizing stories based on engagement metrics starts with tracking dwell time, which measures how long readers stay engaged. High dwell time signals compelling narratives, while low figures indicate drop-offs needing fixes like tighter intros.
Audience insights services aggregate these with shares and comments for a holistic view. For example, a lifestyle blog analyzed dwell time on recipe posts, discovering visuals extended sessions by 35%. Adjusting formats accordingly amplified overall performance.
Bounce Rate and CTR: Early Warning Signals
Bounce rate reveals instant rejections, often from mismatched headlines, while click-through rate (CTR) gauges initial appeal. Optimizing stories based on engagement metrics involves A/B testing headlines—short, question-based ones often lift CTR by 20%.
In a newsroom scenario, high bounce on opinion pieces prompted sentiment-aligned thumbnails. Post-optimization, engagement surged, proving these metrics guide precise tweaks for better resonance.
Collecting and Analyzing Engagement Data
The first step in optimizing stories based on engagement metrics is robust data collection via tools tracking page views, heatmaps, and scroll depth. Audience insights services from Time Intelligence Media Group streamline this, providing dashboards for real-time insights.
Follow these steps:
- Integrate analytics across platforms to capture full user journeys.
- Segment data by audience type, spotting trends like mobile users preferring concise formats.
- Benchmark against industry averages to prioritize high-potential stories.
This methodical approach uncovers hidden opportunities, such as evergreen topics driving repeat engagement.
Applying Insights to Narrative Structure
Once analyzed, reshape stories: trim fluff where scrolls halt, amplify sections with high interaction. A travel media site used heatmap data to reposition key images, boosting completion rates by 28%.
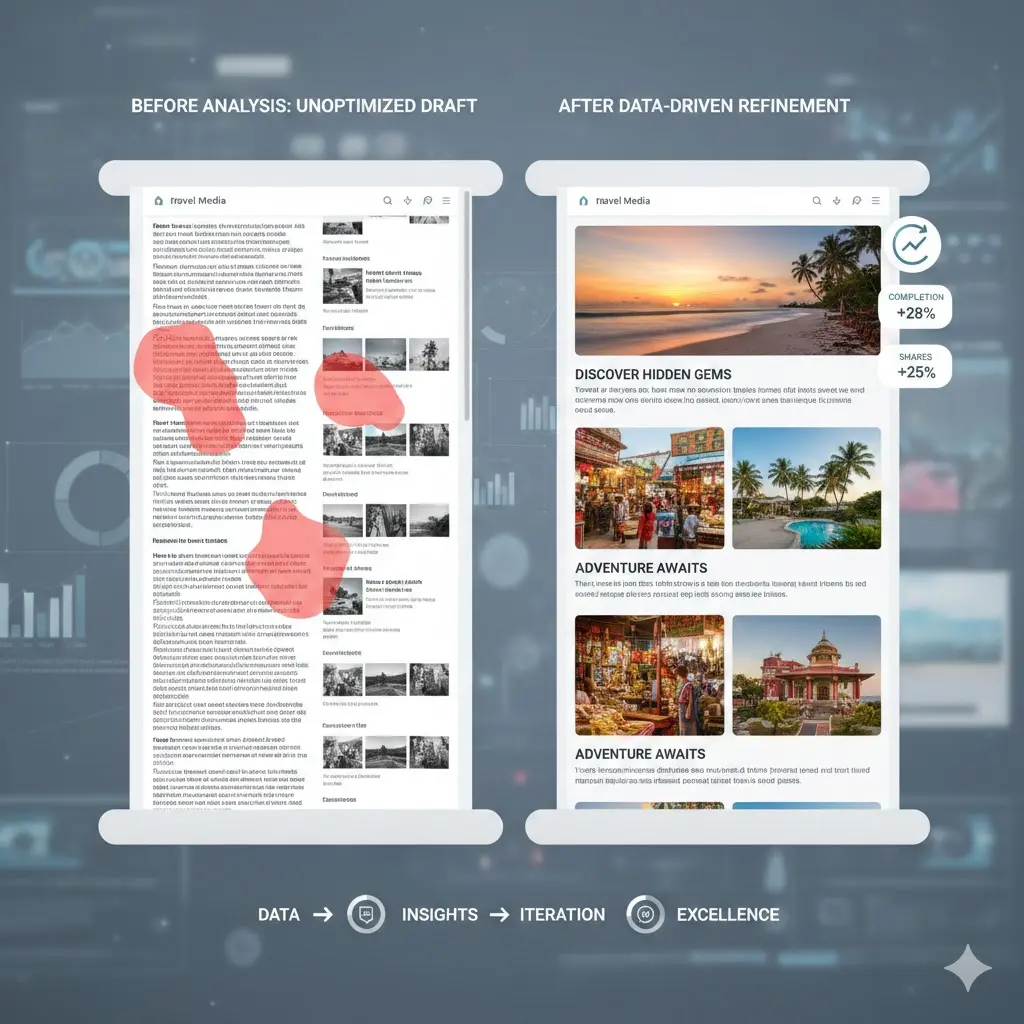
Iterative testing ensures sustained gains. Case studies show outlets refining 70% of drafts this way achieve 25% more shares, directly linking data to storytelling excellence.
AI-Powered Analytics Platforms
Advanced platforms automate optimizing stories based on engagement metrics, using AI to predict viral potential from draft scans. Features like anomaly detection flag underperformers early.
Time Intelligence Media Group clients leverage these for predictive scoring—stories above 80% projected engagement get priority pushes. One outlet saw a 32% traffic increase by greenlighting data-vetted pieces.
Integrating Heatmaps and A/B Testing Tools
Heatmaps visualize attention hotspots, guiding layout tweaks, while A/B tools compare variants live. Combining them reveals preferences, like bullet-point summaries outperforming paragraphs for quick reads.
A business news firm tested intro styles via A/B, finding data-led hooks doubled CTR. These tools make optimization scalable and precise.
From Flops to Hits: A News Outlet’s Turnaround
A regional news site grappled with stagnant traffic. By optimizing stories based on engagement metrics, they identified long intros as culprits. Shortening them and adding subheads lifted dwell time by 40%.
Further, correlating shares with topic clusters prioritized local business coverage, resulting in 55% subscription growth over six months.
Digital Magazine’s Visual Storytelling Pivot
Faced with high bounces, a magazine analyzed metrics showing image-light stories underperformed. Integrating infographics per data insights boosted engagement by 37%, with visuals in high-heatmap zones.
This shift, informed by audience engagement data, expanded their reach and solidified reader habits.
Handling Data Overload and Bias
Optimizing stories based on engagement metrics can overwhelm with volume. Solution: focus on 5-7 key indicators and automate alerts. Address bias by diversifying data sources, ensuring metrics reflect broad audiences.
One team mitigated vanity metrics like raw views by weighting quality signals, yielding truer optimizations.
Adapting to Algorithm Changes
Platform shifts demand agility. Track cross-channel metrics to insulate against changes, like social algorithm tweaks deprioritizing links. Proactive outlets use owned channels, optimizing stories based on engagement metrics from email and apps.
Trends from 2025 show resilient media gaining 22% more loyalty through diversified tracking.
Key Performance Indicators Beyond Basics
Track ROI via metrics like cost-per-engagement and lifetime value. Optimizing stories based on engagement metrics ties directly to revenue, with high-engagement content converting 3x better.
Essential KPIs:
- Engagement-to-Conversion Rate: Links interactions to actions.
- Content Velocity: Speed of metric-informed iterations.
- Audience Growth Attribution: Credits optimizations to expansions.
These quantify value comprehensively.
Scaling Optimization Across Teams
Enterprise-level success involves training and workflows. Collaborative dashboards ensure alignment, with weekly metric reviews driving culture shifts. Results: 30% average engagement lifts industry-wide.
Sustained efforts compound, fostering data-native newsrooms.
In conclusion, optimizing stories based on engagement metrics unlocks media potential through precise, iterative improvements. Time Intelligence Media Group delivers Audience Insights Services tailored for these outcomes. Build foundational knowledge with our guide on understanding audiences to strengthen public trust, and maximize visibility with media intelligence services to drive results.